|
Download Data (XLS File) |
|
||||||||
|
||||||||
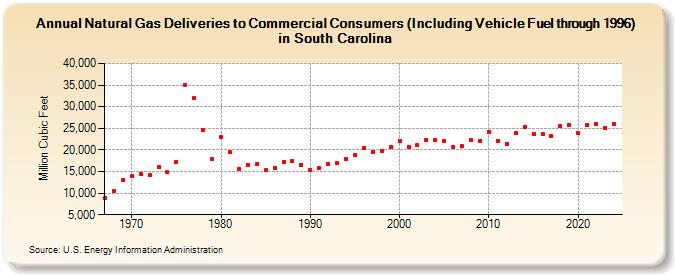
| Natural Gas Deliveries to Commercial Consumers (Including Vehicle Fuel through 1996) in South Carolina (Million Cubic Feet) | ||||||||
| Decade | Year-0 | Year-1 | Year-2 | Year-3 | Year-4 | Year-5 | Year-6 | Year-7 | Year-8 | Year-9 |
|---|---|---|---|---|---|---|---|---|---|---|
| 1960's | 8,840 | 10,544 | 12,938 | |||||||
| 1970's | 13,850 | 14,371 | 14,137 | 16,053 | 14,820 | 17,202 | 35,062 | 32,117 | 24,681 | 17,943 |
| 1980's | 22,885 | 19,436 | 15,560 | 16,548 | 16,635 | 15,270 | 15,894 | 17,195 | 17,472 | 16,525 |
| 1990's | 15,394 | 15,796 | 16,644 | 17,014 | 17,870 | 18,868 | 20,328 | 19,560 | 19,828 | 20,566 |
| 2000's | 22,105 | 20,743 | 21,029 | 22,365 | 22,255 | 22,048 | 20,691 | 20,927 | 22,283 | 21,953 |
| 2010's | 24,119 | 22,113 | 21,416 | 23,862 | 25,398 | 23,752 | 23,734 | 23,128 | 25,551 | 25,707 |
| 2020's | 23,875 | 25,853 | 25,986 | 25,169 | 26,402 | 29,673 |
| - = No Data Reported; -- = Not Applicable; NA = Not Available; W = Withheld to avoid disclosure of individual company data. |
| Release Date: 6/30/2026 |
| Next Release Date: 7/31/2026 |