|
Download Data (XLS File) |
|
||||||||
|
||||||||
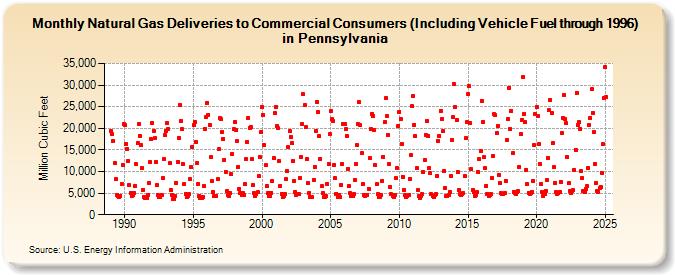
| Natural Gas Deliveries to Commercial Consumers (Including Vehicle Fuel through 1996) in Pennsylvania (Million Cubic Feet) | ||||||||
| Year | Jan | Feb | Mar | Apr | May | Jun | Jul | Aug | Sep | Oct | Nov | Dec |
|---|---|---|---|---|---|---|---|---|---|---|---|---|
| 1989 | 19,310 | 18,682 | 16,972 | 11,988 | 8,259 | 4,646 | 4,270 | 4,158 | 4,375 | 7,181 | 11,582 | 20,997 |
| 1990 | 20,743 | 16,421 | 15,166 | 12,483 | 6,828 | 5,134 | 4,387 | 4,567 | 5,054 | 6,676 | 11,644 | 16,571 |
| 1991 | 21,026 | 18,276 | 16,026 | 10,882 | 5,835 | 4,162 | 3,760 | 3,859 | 4,580 | 7,438 | 12,251 | 17,451 |
| 1992 | 21,204 | 19,482 | 17,679 | 12,210 | 6,793 | 4,520 | 4,046 | 4,132 | 4,579 | 8,439 | 12,784 | 18,385 |
| 1993 | 19,394 | 21,239 | 19,875 | 11,914 | 5,793 | 4,510 | 3,547 | 3,718 | 4,327 | 7,438 | 12,189 | 17,832 |
| 1994 | 25,352 | 21,687 | 19,730 | 11,672 | 7,095 | 4,851 | 4,068 | 4,349 | 4,731 | 8,175 | 10,989 | 15,774 |
| 1995 | 20,758 | 21,364 | 16,824 | 11,960 | 7,223 | 4,435 | 3,929 | 3,935 | 4,210 | 6,583 | 19,918 | 22,596 |
| 1996 | 25,912 | 23,162 | 20,748 | 13,276 | 7,729 | 5,199 | 4,348 | 4,365 | 4,302 | 8,161 | 15,107 | 22,333 |
| 1997 | 22,121 | 19,254 | 17,524 | 12,746 | 9,950 | 5,406 | 4,659 | 4,246 | 4,999 | 9,345 | 14,059 | 19,775 |
| 1998 | 21,500 | 19,608 | 16,969 | 11,091 | 5,955 | 5,005 | 4,584 | 4,996 | 4,507 | 7,032 | 12,808 | 16,940 |
| 1999 | 22,433 | 20,095 | 20,315 | 12,819 | 6,804 | 5,081 | 4,396 | 4,704 | 5,182 | 8,905 | 13,319 | 19,202 |
| 2000 | 24,958 | 23,019 | 16,080 | 11,433 | 6,651 | 5,052 | 4,240 | 4,437 | 5,110 | 7,835 | 13,075 | 23,429 |
| 2001 | 24,955 | 20,519 | 19,980 | 12,405 | 6,661 | 4,883 | 4,157 | 4,220 | 4,753 | 8,255 | 10,114 | 15,565 |
| 2002 | 19,297 | 17,977 | 16,528 | 12,387 | 7,767 | 5,303 | 4,585 | 4,744 | 4,874 | 8,521 | 13,337 | 20,881 |
| 2003 | 27,861 | 25,382 | 20,204 | 12,824 | 7,290 | 5,066 | 4,063 | 4,203 | 4,048 | 8,059 | 11,128 | 19,328 |
| 2004 | 26,034 | 23,790 | 18,174 | 12,908 | 6,539 | 5,007 | 4,139 | 4,160 | 4,304 | 7,185 | 11,763 | 18,604 |
| 2005 | 23,937 | 22,109 | 21,686 | 11,611 | 8,390 | 4,895 | 4,055 | 4,476 | 4,126 | 6,830 | 11,763 | 21,093 |
| 2006 | 21,022 | 19,736 | 18,192 | 10,644 | 6,628 | 4,950 | 4,262 | 4,289 | 4,767 | 8,145 | 11,646 | 16,047 |
| 2007 | 20,915 | 26,077 | 20,657 | 14,210 | 7,129 | 4,578 | 4,296 | 4,465 | 4,583 | 6,041 | 13,118 | 19,784 |
| 2008 | 23,344 | 22,866 | 19,719 | 11,399 | 7,033 | 4,715 | 4,027 | 4,208 | 4,491 | 7,879 | 13,470 | 21,452 |
| 2009 | 26,997 | 22,753 | 18,510 | 11,624 | 6,500 | 4,713 | 4,364 | 4,127 | 4,676 | 8,399 | 10,873 | 20,556 |
| 2010 | 23,831 | 22,230 | 16,472 | 8,827 | 5,773 | 4,454 | 3,999 | 4,368 | 4,516 | 8,331 | 13,804 | 25,094 |
| 2011 | 27,444 | 20,793 | 18,203 | 10,784 | 5,607 | 4,244 | 3,884 | 4,417 | 4,764 | 9,889 | 12,667 | 18,475 |
| 2012 | 21,702 | 18,290 | 10,738 | 9,604 | 4,725 | 4,330 | 3,997 | 4,457 | 4,844 | 8,988 | 17,102 | 18,159 |
| 2013 | 24,115 | 22,258 | 19,303 | 10,074 | 6,201 | 4,288 | 4,241 | 4,589 | 5,262 | 9,040 | 17,211 | 22,532 |
| 2014 | 30,181 | 24,813 | 21,946 | 9,996 | 5,684 | 4,759 | 4,492 | 4,753 | 5,044 | 8,889 | 17,723 | 21,355 |
| 2015 | 27,858 | 29,768 | 21,190 | 10,553 | 5,766 | 5,155 | 4,390 | 4,642 | 5,197 | 9,859 | 12,873 | 14,839 |
| 2016 | 26,331 | 21,414 | 13,281 | 10,708 | 6,755 | 4,886 | 4,419 | 4,607 | 4,845 | 8,461 | 13,683 | 23,333 |
| 2017 | 22,975 | 18,866 | 20,620 | 9,181 | 7,325 | 5,071 | 4,816 | 4,723 | 4,991 | 7,822 | 17,266 | 22,255 |
| 2018 | 29,439 | 19,791 | 24,115 | 14,199 | 5,343 | 5,090 | 4,875 | 5,164 | 5,399 | 11,106 | 18,646 | 21,953 |
| 2019 | 31,830 | 23,308 | 21,378 | 10,434 | 7,083 | 5,099 | 4,890 | 5,066 | 5,308 | 7,888 | 16,072 | 23,266 |
| 2020 | 25,025 | 22,812 | 16,368 | 11,740 | 7,117 | 5,282 | 4,276 | 4,793 | 5,518 | 8,011 | 13,117 | 24,128 |
| 2021 | 26,550 | 23,644 | 16,541 | 10,974 | 7,422 | 5,258 | 4,785 | 4,938 | 5,200 | 7,658 | 18,965 | 22,486 |
| 2022 | 27,695 | 22,043 | 21,166 | 13,349 | 7,310 | 5,473 | 4,922 | 5,596 | 5,640 | 10,299 | 15,045 | 28,231 |
| 2023 | 20,386 | 20,860 | 19,446 | 9,780 | 8,212 | 5,215 | 4,999 | 5,769 | 6,319 | 10,468 | 20,061 | 21,881 |
| 2024 | 27,333 | 22,251 | 18,116 | 11,078 | 6,952 | 5,282 | 5,046 | 5,810 | 6,151 | 9,154 | 15,324 | 25,478 |
| 2025 | 32,997 | 26,335 | 17,776 | 12,765 | 7,980 | 5,487 | 5,152 | 5,898 | 6,048 | 10,113 | 17,777 | 28,999 |
| 2026 | 33,670 | 27,047 | 18,364 | 10,270 | ||||||||
| - = No Data Reported; -- = Not Applicable; NA = Not Available; W = Withheld to avoid disclosure of individual company data. |
| Release Date: 6/30/2026 |
| Next Release Date: 7/31/2026 |