|
Download Data (XLS File) |
|
||||||||
|
||||||||
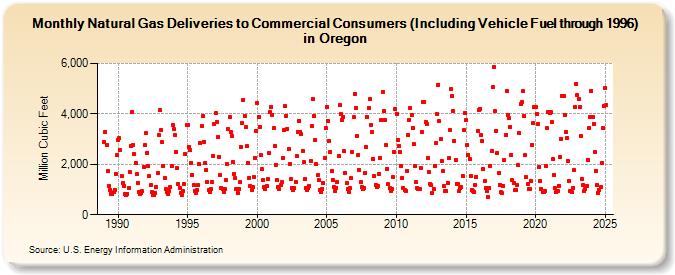
| Natural Gas Deliveries to Commercial Consumers (Including Vehicle Fuel through 1996) in Oregon (Million Cubic Feet) | ||||||||
| Year | Jan | Feb | Mar | Apr | May | Jun | Jul | Aug | Sep | Oct | Nov | Dec |
|---|---|---|---|---|---|---|---|---|---|---|---|---|
| 1989 | 2,884 | 3,283 | 2,761 | 1,724 | 1,140 | 989 | 823 | 804 | 882 | 972 | 1,624 | 2,363 |
| 1990 | 2,984 | 3,031 | 2,562 | 1,550 | 1,268 | 1,157 | 821 | 769 | 823 | 1,050 | 1,697 | 2,737 |
| 1991 | 4,074 | 2,764 | 2,407 | 2,048 | 1,610 | 1,274 | 902 | 812 | 855 | 927 | 1,898 | 2,758 |
| 1992 | 3,231 | 2,465 | 1,925 | 1,542 | 1,171 | 884 | 784 | 782 | 863 | 1,105 | 1,652 | 3,166 |
| 1993 | 4,148 | 3,370 | 2,880 | 1,927 | 1,448 | 1,010 | 915 | 840 | 934 | 1,099 | 1,918 | 3,557 |
| 1994 | 3,388 | 3,166 | 2,480 | 1,836 | 1,234 | 1,078 | 865 | 801 | 924 | 1,213 | 2,401 | 3,573 |
| 1995 | 3,545 | 2,687 | 2,553 | 2,064 | 1,579 | 1,160 | 959 | 879 | 979 | 1,166 | 2,010 | 2,837 |
| 1996 | 3,531 | 3,907 | 2,900 | 2,059 | 1,786 | 1,304 | 967 | 905 | 1,023 | 1,306 | 2,314 | 3,595 |
| 1997 | 4,019 | 3,693 | 3,082 | 2,309 | 1,577 | 1,070 | 1,009 | 914 | 1,025 | 1,365 | 2,020 | 3,382 |
| 1998 | 3,872 | 3,294 | 3,136 | 2,096 | 1,626 | 1,440 | 1,030 | 880 | 1,023 | 1,291 | 2,681 | 3,619 |
| 1999 | 4,571 | 3,912 | 3,480 | 2,709 | 2,061 | 1,467 | 1,132 | 989 | 1,096 | 1,491 | 2,265 | 3,337 |
| 2000 | 4,448 | 3,880 | 3,475 | 2,380 | 1,812 | 1,391 | 1,080 | 1,013 | 1,148 | 1,430 | 2,457 | 4,076 |
| 2001 | 4,271 | 3,960 | 3,429 | 2,719 | 1,984 | 1,362 | 1,084 | 1,030 | 1,162 | 1,284 | 2,252 | 3,348 |
| 2002 | 4,302 | 3,933 | 3,416 | 2,609 | 2,016 | 1,407 | 1,068 | 989 | 1,062 | 1,304 | 2,311 | 3,297 |
| 2003 | 3,737 | 3,287 | 3,183 | 2,544 | 2,088 | 1,409 | 1,057 | 976 | 1,041 | 1,149 | 2,130 | 3,508 |
| 2004 | 4,600 | 3,912 | 2,957 | 2,009 | 1,559 | 1,361 | 978 | 896 | 1,016 | 1,251 | 2,252 | 3,425 |
| 2005 | 4,280 | 3,710 | 2,914 | 2,503 | 1,726 | 1,395 | 1,109 | 948 | 1,072 | 1,304 | 2,337 | 4,334 |
| 2006 | 3,987 | 3,764 | 3,884 | 2,516 | 1,645 | 1,243 | 1,018 | 906 | 1,071 | 1,454 | 2,488 | 3,870 |
| 2007 | 4,793 | 4,240 | 3,139 | 2,374 | 1,786 | 1,306 | 1,083 | 1,003 | 1,064 | 1,655 | 2,692 | 3,871 |
| 2008 | 4,238 | 4,581 | 3,564 | 3,269 | 2,204 | 1,532 | 1,186 | 1,084 | 1,144 | 1,607 | 2,259 | 3,777 |
| 2009 | 4,850 | 4,099 | 3,774 | 2,754 | 1,827 | 1,207 | 1,042 | 955 | 1,033 | 1,497 | 2,493 | 4,211 |
| 2010 | 4,014 | 2,964 | 2,738 | 2,474 | 1,913 | 1,476 | 1,069 | 961 | 950 | 1,740 | 3,170 | 3,777 |
| 2011 | 4,226 | 3,941 | 3,450 | 2,805 | 1,925 | 1,292 | 1,064 | 1,013 | 1,006 | 1,861 | 3,287 | 4,488 |
| 2012 | 4,488 | 3,682 | 3,614 | 2,257 | 1,676 | 1,231 | 1,169 | 856 | 1,035 | 1,951 | 2,844 | 4,001 |
| 2013 | 5,165 | 3,704 | 2,988 | 2,134 | 1,719 | 1,137 | 936 | 947 | 1,261 | 2,236 | 3,369 | 4,970 |
| 2014 | 4,711 | 4,098 | 2,920 | 2,177 | 1,237 | 1,201 | 956 | 1,066 | 1,083 | 1,538 | 3,343 | 4,047 |
| 2015 | 3,745 | 2,770 | 2,373 | 2,193 | 1,539 | 974 | 934 | 916 | 1,175 | 1,499 | 3,326 | 4,159 |
| 2016 | 4,202 | 3,165 | 2,922 | 1,797 | 1,318 | 1,046 | 926 | 697 | 1,071 | 1,949 | 2,520 | 5,055 |
| 2017 | 5,864 | 4,110 | 3,318 | 2,466 | 1,674 | 1,195 | 890 | 851 | 1,147 | 2,158 | 3,172 | 4,918 |
| 2018 | 3,957 | 3,828 | 3,485 | 2,374 | 1,362 | 1,257 | 970 | 993 | 1,180 | 1,957 | 3,235 | 4,399 |
| 2019 | 4,455 | 4,890 | 3,916 | 2,366 | 1,495 | 1,217 | 1,003 | 1,039 | 1,341 | 2,768 | 3,626 | 4,263 |
| 2020 | 4,272 | 4,013 | 3,613 | 1,910 | 1,328 | 1,039 | 883 | 889 | 948 | 1,946 | 3,423 | 4,086 |
| 2021 | 4,019 | 4,063 | 3,686 | 2,204 | 1,586 | 1,058 | 920 | 958 | 1,159 | 2,304 | 3,023 | 4,720 |
| 2022 | 4,718 | 3,967 | 3,270 | 3,049 | 2,133 | 1,327 | 944 | 917 | 1,075 | 1,771 | 4,259 | 5,203 |
| 2023 | 4,730 | 4,573 | 4,257 | 3,129 | 1,426 | 1,191 | 924 | 1,001 | 1,175 | 2,187 | 3,434 | 3,884 |
| 2024 | 4,856 | 3,844 | 3,565 | 2,474 | 1,713 | 1,151 | 870 | 985 | 1,066 | 2,031 | 3,398 | 4,273 |
| 2025 | 5,012 | 4,335 | 3,406 | 2,136 | 1,582 | 1,105 | 915 | 933 | 1,039 | 2,157 | 2,905 | 3,573 |
| 2026 | 4,424 | 3,593 | 2,899 | 2,166 | ||||||||
| - = No Data Reported; -- = Not Applicable; NA = Not Available; W = Withheld to avoid disclosure of individual company data. |
| Release Date: 6/30/2026 |
| Next Release Date: 7/31/2026 |