|
Download Data (XLS File) |
|
||||||||
|
||||||||
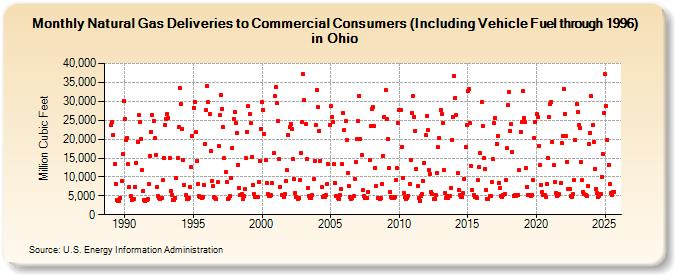
| Natural Gas Deliveries to Commercial Consumers (Including Vehicle Fuel through 1996) in Ohio (Million Cubic Feet) | ||||||||
| Year | Jan | Feb | Mar | Apr | May | Jun | Jul | Aug | Sep | Oct | Nov | Dec |
|---|---|---|---|---|---|---|---|---|---|---|---|---|
| 1989 | 23,636 | 24,435 | 21,187 | 13,360 | 8,237 | 3,927 | 3,565 | 3,735 | 4,397 | 8,946 | 15,949 | 30,143 |
| 1990 | 25,317 | 19,642 | 20,361 | 13,373 | 7,446 | 4,838 | 3,975 | 4,165 | 4,240 | 7,272 | 13,757 | 19,190 |
| 1991 | 26,286 | 24,481 | 20,157 | 11,779 | 6,341 | 3,971 | 3,703 | 3,933 | 4,196 | 8,065 | 15,488 | 21,940 |
| 1992 | 26,321 | 24,820 | 20,215 | 15,893 | 7,455 | 5,016 | 4,291 | 4,260 | 4,418 | 9,092 | 15,094 | 23,770 |
| 1993 | 25,230 | 26,706 | 25,531 | 15,019 | 6,359 | 5,221 | 3,939 | 3,860 | 4,492 | 9,636 | 14,979 | 23,071 |
| 1994 | 33,573 | 29,301 | 22,713 | 14,498 | 7,933 | 5,111 | 4,027 | 4,287 | 4,492 | 7,331 | 12,594 | 20,936 |
| 1995 | 28,306 | 29,814 | 21,860 | 14,128 | 8,132 | 4,979 | 4,697 | 4,406 | 4,623 | 7,916 | 18,650 | 27,649 |
| 1996 | 33,993 | 29,732 | 26,650 | 16,833 | 8,960 | 7,661 | 4,569 | 4,401 | 4,048 | 8,548 | 18,274 | 26,298 |
| 1997 | 31,650 | 28,014 | 23,080 | 15,083 | 11,231 | 8,632 | 4,095 | 4,351 | 4,942 | 9,715 | 17,725 | 25,319 |
| 1998 | 27,257 | 24,176 | 21,607 | 13,278 | 7,127 | 5,162 | 5,461 | 4,036 | 4,995 | 6,706 | 14,894 | 21,929 |
| 1999 | 28,716 | 26,667 | 24,157 | 15,161 | 7,794 | 5,468 | 4,642 | 4,661 | 4,732 | 8,550 | 14,267 | 22,759 |
| 2000 | 29,710 | 27,683 | 21,391 | 14,402 | 8,421 | 5,402 | 4,999 | 4,948 | 5,112 | 8,271 | 16,308 | 31,270 |
| 2001 | 33,726 | 29,565 | 24,800 | 14,665 | 7,443 | 5,345 | 5,113 | 4,609 | 5,472 | 8,991 | 11,695 | 21,130 |
| 2002 | 23,126 | 24,115 | 22,697 | 14,829 | 9,398 | 5,759 | 4,668 | 4,277 | 4,382 | 9,168 | 16,250 | 24,603 |
| 2003 | 37,157 | 30,234 | 23,988 | 14,641 | 7,074 | 5,019 | 4,494 | 4,443 | 5,275 | 9,378 | 14,238 | 23,670 |
| 2004 | 33,101 | 28,402 | 22,171 | 14,297 | 7,214 | 4,795 | 4,842 | 4,785 | 5,143 | 8,239 | 13,443 | 23,808 |
| 2005 | 28,695 | 25,748 | 24,561 | 13,348 | 8,394 | 4,968 | 4,400 | 4,256 | 5,237 | 6,840 | 13,368 | 26,878 |
| 2006 | 22,428 | 24,722 | 19,878 | 10,958 | 7,527 | 4,677 | 4,223 | 4,316 | 4,820 | 9,517 | 13,864 | 20,000 |
| 2007 | 24,817 | 31,494 | 20,042 | 15,799 | 6,513 | 4,846 | 4,368 | 4,315 | 4,404 | 6,103 | 14,458 | 23,421 |
| 2008 | 27,867 | 28,366 | 23,495 | 12,470 | 7,714 | 4,329 | 4,425 | 4,240 | 4,351 | 8,220 | 15,650 | 25,944 |
| 2009 | 33,019 | 25,298 | 20,017 | 12,268 | 6,084 | 4,607 | 4,351 | 4,338 | 4,811 | 9,111 | 12,400 | 24,309 |
| 2010 | 27,713 | 27,819 | 17,933 | 9,785 | 5,698 | 4,596 | 4,072 | 4,390 | 5,014 | 8,075 | 14,398 | 26,914 |
| 2011 | 31,485 | 25,802 | 22,239 | 12,094 | 7,593 | 4,318 | 3,753 | 4,912 | 5,465 | 8,965 | 13,808 | 20,975 |
| 2012 | 26,190 | 22,313 | 11,889 | 10,803 | 6,123 | 5,403 | 4,075 | 4,155 | 5,222 | 11,139 | 17,805 | 20,364 |
| 2013 | 27,740 | 26,688 | 24,284 | 11,848 | 5,709 | 4,464 | 4,980 | 4,518 | 5,071 | 7,198 | 19,814 | 25,921 |
| 2014 | 36,807 | 30,959 | 26,332 | 10,918 | 6,482 | 5,269 | 4,799 | 4,697 | 5,640 | 9,491 | 17,953 | 23,759 |
| 2015 | 32,696 | 33,326 | 24,200 | 12,865 | 6,476 | 5,217 | 4,679 | 4,716 | 4,465 | 9,078 | 12,682 | 16,202 |
| 2016 | 29,819 | 23,507 | 14,931 | 12,085 | 6,641 | 4,163 | 4,191 | 4,901 | 4,897 | 8,563 | 14,607 | 24,175 |
| 2017 | 25,694 | 18,791 | 20,883 | 8,461 | 7,178 | 5,036 | 4,675 | 5,106 | 5,499 | 9,163 | 17,577 | 28,916 |
| 2018 | 32,581 | 22,244 | 24,123 | 16,493 | 4,954 | 5,143 | 4,837 | 5,203 | 5,324 | 11,733 | 21,890 | 24,468 |
| 2019 | 32,716 | 25,548 | 24,505 | 12,343 | 7,456 | 5,315 | 5,186 | 5,007 | 5,246 | 9,152 | 20,364 | 24,590 |
| 2020 | 26,521 | 25,934 | 18,233 | 13,186 | 7,931 | 5,958 | 5,138 | 5,205 | 4,773 | 8,163 | 15,034 | 25,953 |
| 2021 | 29,287 | 29,833 | 19,231 | 13,044 | 8,677 | 5,817 | 4,994 | 5,093 | 5,374 | 8,358 | 18,891 | 20,850 |
| 2022 | 33,332 | 26,645 | 20,793 | 14,036 | 6,855 | 6,741 | 5,023 | 4,791 | 5,361 | 9,143 | 19,767 | 29,188 |
| 2023 | 26,872 | 23,619 | 22,687 | 13,801 | 9,040 | 5,997 | 5,397 | 5,201 | 4,944 | 7,635 | 18,623 | 21,542 |
| 2024 | 30,574 | 23,075 | 18,672 | 11,696 | 6,582 | 5,642 | 4,604 | 4,835 | 5,379 | 9,090 | 15,765 | 26,174 |
| 2025 | 36,896 | 28,740 | 19,752 | 13,168 | 8,081 | 5,587 | 5,059 | 5,774 | 6,105 | 9,961 | 19,377 | 30,342 |
| 2026 | 35,467 | 26,917 | 20,632 | 10,635 | ||||||||
| - = No Data Reported; -- = Not Applicable; NA = Not Available; W = Withheld to avoid disclosure of individual company data. |
| Release Date: 6/30/2026 |
| Next Release Date: 7/31/2026 |