|
Download Data (XLS File) |
|
||||||||
|
||||||||
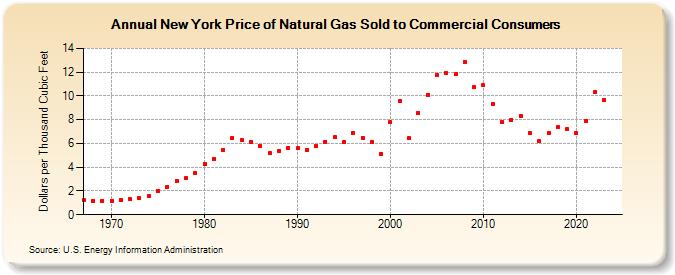
| New York Price of Natural Gas Sold to Commercial Consumers (Dollars per Thousand Cubic Feet) | ||||||||
| Decade | Year-0 | Year-1 | Year-2 | Year-3 | Year-4 | Year-5 | Year-6 | Year-7 | Year-8 | Year-9 |
|---|---|---|---|---|---|---|---|---|---|---|
| 1960's | 1.22 | 1.19 | 1.19 | |||||||
| 1970's | 1.19 | 1.27 | 1.30 | 1.37 | 1.59 | 2.00 | 2.35 | 2.85 | 3.05 | 3.50 |
| 1980's | 4.27 | 4.73 | 5.48 | 6.48 | 6.25 | 6.11 | 5.77 | 5.17 | 5.39 | 5.62 |
| 1990's | 5.59 | 5.47 | 5.75 | 6.16 | 6.51 | 6.10 | 6.88 | 6.49 | 6.08 | 5.15 |
| 2000's | 7.77 | 9.61 | 6.42 | 8.60 | 10.11 | 11.80 | 11.91 | 11.82 | 12.86 | 10.72 |
| 2010's | 10.88 | 9.32 | 7.84 | 8.00 | 8.31 | 6.86 | 6.19 | 6.87 | 7.36 | 7.21 |
| 2020's | 6.88 | 7.91 | 10.31 | 9.59 | 10.39 | 11.47 |
| - = No Data Reported; -- = Not Applicable; NA = Not Available; W = Withheld to avoid disclosure of individual company data. |
| Release Date: 6/30/2026 |
| Next Release Date: 7/31/2026 |