|
Download Data (XLS File) |
|
||||||||
|
||||||||
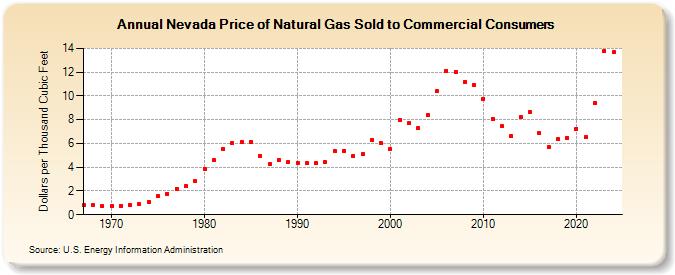
| Nevada Price of Natural Gas Sold to Commercial Consumers (Dollars per Thousand Cubic Feet) | ||||||||
| Decade | Year-0 | Year-1 | Year-2 | Year-3 | Year-4 | Year-5 | Year-6 | Year-7 | Year-8 | Year-9 |
|---|---|---|---|---|---|---|---|---|---|---|
| 1960's | 0.78 | 0.78 | 0.75 | |||||||
| 1970's | 0.76 | 0.77 | 0.80 | 0.87 | 1.06 | 1.55 | 1.77 | 2.20 | 2.40 | 2.80 |
| 1980's | 3.87 | 4.58 | 5.54 | 6.03 | 6.14 | 6.12 | 4.91 | 4.29 | 4.62 | 4.44 |
| 1990's | 4.38 | 4.34 | 4.33 | 4.40 | 5.36 | 5.40 | 4.91 | 5.08 | 6.28 | 6.02 |
| 2000's | 5.54 | 8.00 | 7.71 | 7.29 | 8.38 | 10.39 | 12.12 | 12.03 | 11.21 | 10.92 |
| 2010's | 9.77 | 8.07 | 7.43 | 6.61 | 8.21 | 8.66 | 6.84 | 5.71 | 6.34 | 6.49 |
| 2020's | 7.25 | 6.56 | 9.39 | 13.79 | 13.67 | 7.51 |
| - = No Data Reported; -- = Not Applicable; NA = Not Available; W = Withheld to avoid disclosure of individual company data. |
| Release Date: 6/30/2026 |
| Next Release Date: 7/31/2026 |
Referring Pages: