|
Download Data (XLS File) |
|
||||||||
|
||||||||
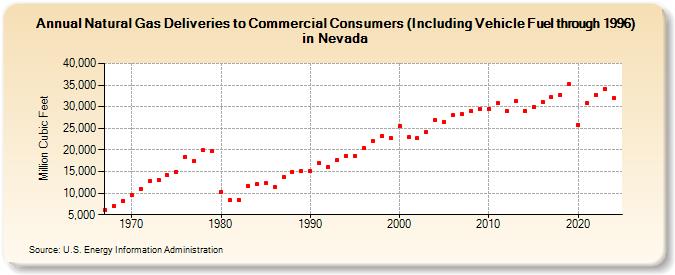
| Natural Gas Deliveries to Commercial Consumers (Including Vehicle Fuel through 1996) in Nevada (Million Cubic Feet) | ||||||||
| Decade | Year-0 | Year-1 | Year-2 | Year-3 | Year-4 | Year-5 | Year-6 | Year-7 | Year-8 | Year-9 |
|---|---|---|---|---|---|---|---|---|---|---|
| 1960's | 6,164 | 6,997 | 8,204 | |||||||
| 1970's | 9,633 | 11,014 | 12,755 | 13,144 | 14,078 | 14,965 | 18,389 | 17,436 | 19,940 | 19,638 |
| 1980's | 10,207 | 8,294 | 8,449 | 11,758 | 12,012 | 12,232 | 11,451 | 13,747 | 14,879 | 15,116 |
| 1990's | 15,073 | 16,960 | 16,101 | 17,549 | 18,694 | 18,703 | 20,421 | 21,958 | 23,314 | 22,710 |
| 2000's | 25,586 | 22,912 | 22,685 | 24,099 | 26,862 | 26,552 | 28,046 | 28,224 | 28,920 | 29,531 |
| 2010's | 29,475 | 30,763 | 28,991 | 31,211 | 29,105 | 29,873 | 31,125 | 32,200 | 32,772 | 35,190 |
| 2020's | 25,837 | 30,739 | 32,766 | 33,996 | 32,129 | 30,629 |
| - = No Data Reported; -- = Not Applicable; NA = Not Available; W = Withheld to avoid disclosure of individual company data. |
| Release Date: 6/30/2026 |
| Next Release Date: 7/31/2026 |