|
Download Data (XLS File) |
|
||||||||
|
||||||||
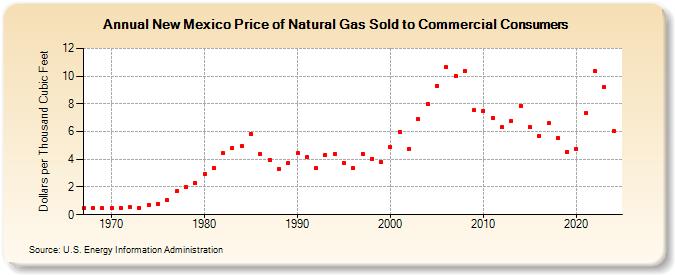
| New Mexico Price of Natural Gas Sold to Commercial Consumers (Dollars per Thousand Cubic Feet) | ||||||||
| Decade | Year-0 | Year-1 | Year-2 | Year-3 | Year-4 | Year-5 | Year-6 | Year-7 | Year-8 | Year-9 |
|---|---|---|---|---|---|---|---|---|---|---|
| 1960's | 0.49 | 0.47 | 0.47 | |||||||
| 1970's | 0.48 | 0.50 | 0.53 | 0.52 | 0.72 | 0.80 | 1.07 | 1.68 | 2.00 | 2.30 |
| 1980's | 2.93 | 3.39 | 4.43 | 4.80 | 4.96 | 5.81 | 4.37 | 3.97 | 3.31 | 3.72 |
| 1990's | 4.43 | 4.15 | 3.36 | 4.31 | 4.41 | 3.74 | 3.35 | 4.41 | 4.04 | 3.78 |
| 2000's | 4.90 | 5.99 | 4.75 | 6.89 | 7.99 | 9.31 | 10.65 | 10.04 | 10.39 | 7.52 |
| 2010's | 7.47 | 6.98 | 6.31 | 6.77 | 7.87 | 6.32 | 5.68 | 6.59 | 5.57 | 4.56 |
| 2020's | 4.76 | 7.33 | 10.34 | 9.19 | 5.94 | 6.34 |
| - = No Data Reported; -- = Not Applicable; NA = Not Available; W = Withheld to avoid disclosure of individual company data. |
| Release Date: 6/30/2026 |
| Next Release Date: 7/31/2026 |