|
Download Data (XLS File) |
|
||||||||
|
||||||||
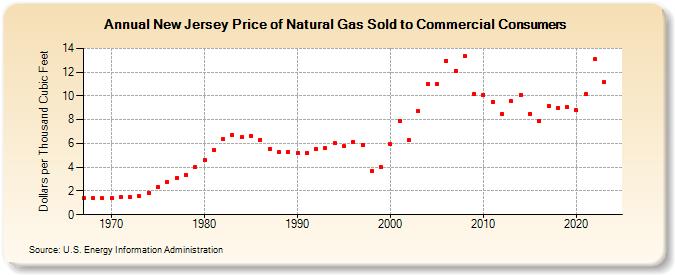
| New Jersey Price of Natural Gas Sold to Commercial Consumers (Dollars per Thousand Cubic Feet) | ||||||||
| Decade | Year-0 | Year-1 | Year-2 | Year-3 | Year-4 | Year-5 | Year-6 | Year-7 | Year-8 | Year-9 |
|---|---|---|---|---|---|---|---|---|---|---|
| 1960's | 1.41 | 1.37 | 1.38 | |||||||
| 1970's | 1.42 | 1.46 | 1.49 | 1.55 | 1.86 | 2.33 | 2.77 | 3.10 | 3.37 | 3.99 |
| 1980's | 4.60 | 5.48 | 6.36 | 6.69 | 6.53 | 6.63 | 6.33 | 5.54 | 5.24 | 5.30 |
| 1990's | 5.20 | 5.21 | 5.54 | 5.60 | 6.03 | 5.76 | 6.14 | 5.88 | 3.70 | 3.99 |
| 2000's | 5.92 | 7.91 | 6.26 | 8.74 | 10.97 | 10.99 | 12.98 | 12.10 | 13.38 | 10.20 |
| 2010's | 10.11 | 9.51 | 8.50 | 9.55 | 10.08 | 8.50 | 7.93 | 9.14 | 9.01 | 9.05 |
| 2020's | 8.79 | 10.14 | 13.08 | 11.14 | 11.58 | NA |
| - = No Data Reported; -- = Not Applicable; NA = Not Available; W = Withheld to avoid disclosure of individual company data. |
| Release Date: 6/30/2026 |
| Next Release Date: 7/31/2026 |