|
Download Data (XLS File) |
|
||||||||
|
||||||||
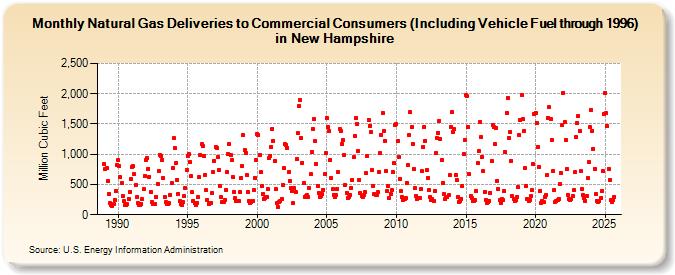
| Natural Gas Deliveries to Commercial Consumers (Including Vehicle Fuel through 1996) in New Hampshire (Million Cubic Feet) | ||||||||
| Year | Jan | Feb | Mar | Apr | May | Jun | Jul | Aug | Sep | Oct | Nov | Dec |
|---|---|---|---|---|---|---|---|---|---|---|---|---|
| 1989 | 842 | 753 | 771 | 551 | 339 | 188 | 154 | 140 | 176 | 248 | 393 | 817 |
| 1990 | 899 | 803 | 618 | 518 | 307 | 221 | 153 | 153 | 170 | 265 | 380 | 585 |
| 1991 | 795 | 798 | 672 | 484 | 291 | 186 | 155 | 156 | 173 | 256 | 420 | 643 |
| 1992 | 911 | 931 | 762 | 629 | 376 | 208 | 179 | 169 | 174 | 295 | 515 | 715 |
| 1993 | 993 | 973 | 911 | 611 | 294 | 204 | 177 | 171 | 186 | 332 | 522 | 770 |
| 1994 | 1,261 | 1,097 | 863 | 581 | 347 | 229 | 173 | 166 | 206 | 305 | 442 | 743 |
| 1995 | 978 | 999 | 864 | 632 | 369 | 227 | 188 | 166 | 197 | 285 | 620 | 989 |
| 1996 | 1,163 | 1,129 | 972 | 661 | 402 | 244 | 180 | 193 | 201 | 360 | 698 | 896 |
| 1997 | 1,121 | 1,110 | 954 | 739 | 472 | 286 | 216 | 217 | 249 | 411 | 703 | 1,010 |
| 1998 | 1,167 | 994 | 898 | 623 | 376 | 280 | 228 | 229 | 222 | 371 | 612 | 810 |
| 1999 | 1,312 | 1,070 | 1,026 | 658 | 381 | 221 | 196 | 204 | 227 | 403 | 614 | 901 |
| 2000 | 1,335 | 1,314 | 994 | 707 | 472 | 342 | 263 | 276 | 295 | 417 | 931 | 977 |
| 2001 | 1,123 | 1,425 | 1,219 | 886 | 417 | 187 | 126 | 218 | 231 | 260 | 493 | 765 |
| 2002 | 1,163 | 1,149 | 1,104 | 700 | 557 | 436 | 399 | 193 | 437 | 369 | 917 | 1,344 |
| 2003 | 1,792 | 1,892 | 1,267 | 863 | 520 | 291 | 303 | 320 | 290 | 435 | 667 | 1,034 |
| 2004 | 1,423 | 1,585 | 1,213 | 844 | 479 | 364 | 297 | 303 | 336 | 416 | 666 | 1,017 |
| 2005 | 1,597 | 1,449 | 1,382 | 911 | 605 | 418 | 322 | 286 | 319 | 429 | 710 | 1,419 |
| 2006 | 1,381 | 1,173 | 1,227 | 981 | 491 | 361 | 276 | 290 | 332 | 448 | 580 | 954 |
| 2007 | 1,309 | 1,597 | 1,505 | 1,050 | 580 | 357 | 310 | 300 | 320 | 374 | 683 | 974 |
| 2008 | 1,573 | 1,471 | 1,364 | 731 | 471 | 349 | 331 | 333 | 369 | 709 | 1,019 | 1,325 |
| 2009 | 1,685 | 1,382 | 1,222 | 719 | 391 | 477 | 269 | 344 | 404 | 705 | 850 | 1,485 |
| 2010 | 1,492 | 1,225 | 958 | 596 | 387 | 295 | 243 | 266 | 270 | 532 | 823 | 1,318 |
| 2011 | 1,690 | 1,446 | 1,177 | 756 | 436 | 315 | 253 | 278 | 269 | 424 | 718 | 1,127 |
| 2012 | 1,453 | 1,225 | 733 | 606 | 404 | 301 | 246 | 259 | 225 | 394 | 1,020 | 1,264 |
| 2013 | 1,355 | 1,550 | 1,251 | 910 | 532 | 344 | 257 | 290 | 286 | 321 | 654 | 1,455 |
| 2014 | 1,691 | 1,372 | 1,409 | 658 | 582 | 292 | 215 | 224 | 260 | 481 | 996 | 1,233 |
| 2015 | 1,975 | 1,955 | 1,455 | 673 | 308 | 274 | 229 | 233 | 240 | 389 | 850 | 1,050 |
| 2016 | 1,539 | 1,283 | 962 | 716 | 381 | 248 | 200 | 203 | 234 | 365 | 892 | 1,486 |
| 2017 | 1,446 | 1,165 | 1,439 | 564 | 425 | 239 | 192 | 256 | 244 | 388 | 1,034 | 1,685 |
| 2018 | 1,934 | 1,269 | 1,370 | 895 | 304 | 267 | 223 | 248 | 290 | 451 | 1,316 | 1,561 |
| 2019 | 1,975 | 1,581 | 1,386 | 772 | 481 | 259 | 231 | 245 | 307 | 404 | 835 | 1,660 |
| 2020 | 1,688 | 1,522 | 1,127 | 792 | 391 | 199 | 229 | 204 | 286 | 329 | 664 | 1,604 |
| 2021 | 1,773 | 1,580 | 1,240 | 723 | 407 | 213 | 221 | 240 | 267 | 503 | 689 | 1,481 |
| 2022 | 2,019 | 1,533 | 1,238 | 761 | 323 | 267 | 241 | 261 | 310 | 405 | 701 | 1,288 |
| 2023 | 1,600 | 1,614 | 1,377 | 717 | 427 | 318 | 270 | 227 | 307 | 594 | 857 | 1,428 |
| 2024 | 1,728 | 1,384 | 1,087 | 760 | 335 | 231 | 202 | 226 | 272 | 385 | 713 | 1,653 |
| 2025 | 2,020 | 1,675 | 1,464 | 763 | 576 | 236 | 208 | 243 | 299 | 604 | 1,179 | 1,811 |
| 2026 | 2,020 | 1,685 | 1,276 | 738 | ||||||||
| - = No Data Reported; -- = Not Applicable; NA = Not Available; W = Withheld to avoid disclosure of individual company data. |
| Release Date: 6/30/2026 |
| Next Release Date: 7/31/2026 |