|
Download Data (XLS File) |
|
||||||||
|
||||||||
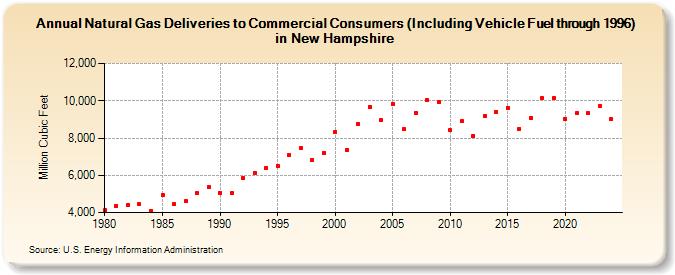
| Natural Gas Deliveries to Commercial Consumers (Including Vehicle Fuel through 1996) in New Hampshire (Million Cubic Feet) | ||||||||
| Decade | Year-0 | Year-1 | Year-2 | Year-3 | Year-4 | Year-5 | Year-6 | Year-7 | Year-8 | Year-9 |
|---|---|---|---|---|---|---|---|---|---|---|
| 1980's | 4,116 | 4,376 | 4,414 | 4,437 | 4,100 | 4,955 | 4,438 | 4,601 | 5,034 | 5,371 |
| 1990's | 5,073 | 5,028 | 5,862 | 6,142 | 6,412 | 6,514 | 7,099 | 7,489 | 6,808 | 7,214 |
| 2000's | 8,323 | 7,349 | 8,768 | 9,673 | 8,943 | 9,844 | 8,494 | 9,360 | 10,043 | 9,935 |
| 2010's | 8,406 | 8,890 | 8,130 | 9,204 | 9,412 | 9,630 | 8,509 | 9,078 | 10,129 | 10,135 |
| 2020's | 9,036 | 9,338 | 9,346 | 9,737 | 8,978 | 11,078 |
| - = No Data Reported; -- = Not Applicable; NA = Not Available; W = Withheld to avoid disclosure of individual company data. |
| Release Date: 6/30/2026 |
| Next Release Date: 7/31/2026 |