|
Download Data (XLS File) |
|
||||||||
|
||||||||
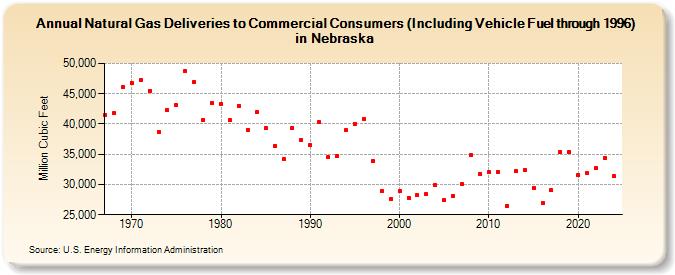
| Natural Gas Deliveries to Commercial Consumers (Including Vehicle Fuel through 1996) in Nebraska (Million Cubic Feet) | ||||||||
| Decade | Year-0 | Year-1 | Year-2 | Year-3 | Year-4 | Year-5 | Year-6 | Year-7 | Year-8 | Year-9 |
|---|---|---|---|---|---|---|---|---|---|---|
| 1960's | 41,443 | 41,765 | 46,041 | |||||||
| 1970's | 46,824 | 47,261 | 45,518 | 38,690 | 42,298 | 43,117 | 48,713 | 46,989 | 40,736 | 43,507 |
| 1980's | 43,356 | 40,612 | 43,022 | 39,055 | 41,900 | 39,404 | 36,357 | 34,205 | 39,388 | 37,351 |
| 1990's | 36,489 | 40,291 | 34,490 | 34,745 | 38,946 | 40,044 | 40,833 | 33,853 | 28,911 | 27,586 |
| 2000's | 28,907 | 27,792 | 28,185 | 28,368 | 29,858 | 27,401 | 28,087 | 30,067 | 34,813 | 31,790 |
| 2010's | 31,993 | 32,115 | 26,503 | 32,214 | 32,407 | 29,464 | 26,971 | 29,018 | 35,349 | 35,388 |
| 2020's | 31,600 | 31,822 | 32,708 | 34,206 | 32,389 | 32,725 |
| - = No Data Reported; -- = Not Applicable; NA = Not Available; W = Withheld to avoid disclosure of individual company data. |
| Release Date: 6/30/2026 |
| Next Release Date: 7/31/2026 |