|
Download Data (XLS File) |
|
||||||||
|
||||||||
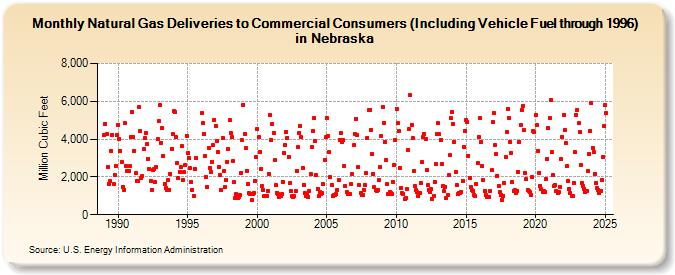
| Natural Gas Deliveries to Commercial Consumers (Including Vehicle Fuel through 1996) in Nebraska (Million Cubic Feet) | ||||||||
| Year | Jan | Feb | Mar | Apr | May | Jun | Jul | Aug | Sep | Oct | Nov | Dec |
|---|---|---|---|---|---|---|---|---|---|---|---|---|
| 1989 | 4,202 | 4,825 | 4,252 | 2,505 | 1,648 | 1,757 | 3,381 | 4,240 | 1,634 | 2,109 | 2,602 | 4,196 |
| 1990 | 4,765 | 4,019 | 3,355 | 2,799 | 1,480 | 1,325 | 4,837 | 2,596 | 2,333 | 2,334 | 2,552 | 4,094 |
| 1991 | 5,452 | 4,111 | 3,382 | 2,193 | 1,771 | 1,779 | 5,675 | 4,406 | 1,961 | 2,056 | 3,468 | 4,037 |
| 1992 | 4,332 | 3,760 | 2,970 | 2,411 | 1,781 | 1,330 | 2,366 | 2,393 | 1,710 | 2,508 | 3,988 | 4,941 |
| 1993 | 5,784 | 3,806 | 4,611 | 3,119 | 1,629 | 1,388 | 1,324 | 1,828 | 1,333 | 2,164 | 3,495 | 4,263 |
| 1994 | 5,469 | 5,455 | 4,089 | 2,741 | 1,934 | 2,284 | 2,501 | 3,613 | 1,834 | 2,239 | 2,606 | 4,182 |
| 1995 | 3,282 | 2,977 | 2,455 | 1,742 | 1,320 | 1,003 | 2,436 | 2,997 | NA | NA | NA | NA |
| 1996 | 5,382 | 4,846 | 4,257 | 3,099 | 1,995 | 1,460 | 3,544 | 2,489 | 2,273 | 2,778 | 3,678 | 5,032 |
| 1997 | 4,714 | 3,925 | 3,330 | 2,520 | 2,093 | 1,309 | 4,067 | 2,295 | 1,477 | 1,855 | 2,812 | 3,454 |
| 1998 | 4,992 | 4,310 | 4,097 | 2,829 | 1,717 | 869 | 1,085 | 862 | 963 | 1,036 | 2,218 | 3,934 |
| 1999 | 5,817 | 4,265 | 3,504 | 2,320 | 1,617 | 1,128 | 1,080 | 787 | 1,071 | 1,166 | 1,798 | 3,034 |
| 2000 | 4,547 | 4,099 | 3,330 | 2,427 | 1,539 | 1,325 | 972 | 971 | 1,014 | 1,249 | 2,151 | 5,284 |
| 2001 | 3,941 | 4,792 | 4,326 | 2,877 | 1,554 | 1,162 | 1,090 | 954 | 1,006 | 1,079 | 1,742 | 3,269 |
| 2002 | 3,688 | 4,376 | 4,074 | 3,063 | 1,668 | 1,267 | 984 | 940 | 973 | 1,236 | 2,337 | 3,579 |
| 2003 | 4,299 | 4,708 | 4,085 | 2,482 | 1,586 | 1,134 | 1,010 | 1,112 | 946 | 1,277 | 2,163 | 3,565 |
| 2004 | 4,411 | 5,104 | 3,888 | 2,084 | 1,374 | 987 | 1,191 | 1,071 | 1,135 | 1,613 | 2,902 | 4,097 |
| 2005 | 5,098 | 4,149 | 3,311 | 1,975 | 1,592 | 999 | 1,046 | 1,024 | 1,091 | 1,324 | 1,835 | 3,958 |
| 2006 | 4,319 | 3,826 | 3,932 | 2,579 | 1,515 | 1,180 | 1,083 | 1,095 | 1,102 | 1,630 | 2,159 | 3,667 |
| 2007 | 4,296 | 5,078 | 4,202 | 2,508 | 1,558 | 1,137 | 1,066 | 1,052 | 1,317 | 1,591 | 2,187 | 4,075 |
| 2008 | 5,538 | 5,557 | 4,474 | 3,223 | 2,158 | 1,444 | 1,327 | 1,248 | 1,289 | 1,846 | 2,528 | 4,180 |
| 2009 | 5,683 | 4,868 | 3,860 | 2,906 | 1,615 | 1,086 | 1,196 | 1,171 | 1,105 | 1,752 | 2,617 | 3,932 |
| 2010 | 5,617 | 4,829 | 4,420 | 2,480 | 1,429 | 1,143 | 1,084 | 831 | 880 | 1,342 | 3,419 | 4,518 |
| 2011 | 6,307 | 4,768 | 4,044 | 2,318 | 1,499 | 1,311 | 1,181 | 987 | 1,127 | 1,665 | 2,814 | 4,093 |
| 2012 | 4,260 | 4,007 | 2,354 | 1,546 | 1,323 | 1,184 | 1,346 | 847 | 982 | 1,737 | 2,663 | 4,252 |
| 2013 | 4,829 | 4,265 | 3,953 | 2,689 | 1,513 | 1,233 | 1,484 | 875 | 1,047 | 2,080 | 3,145 | 5,099 |
| 2014 | 5,443 | 4,818 | 3,859 | 2,280 | 1,557 | 1,101 | 1,161 | 1,166 | 1,222 | 1,773 | 3,608 | 4,419 |
| 2015 | 5,012 | 4,904 | 3,127 | 1,957 | 1,460 | 1,281 | 1,264 | 1,044 | 964 | 1,616 | 2,718 | 4,117 |
| 2016 | 5,094 | 3,846 | 2,565 | 1,817 | 1,267 | 1,048 | 960 | 930 | 954 | 1,259 | 2,339 | 4,892 |
| 2017 | 5,384 | 3,687 | 3,235 | 2,065 | 1,497 | 1,189 | 1,035 | 804 | 1,005 | 1,689 | 3,037 | 4,389 |
| 2018 | 5,587 | 5,102 | 3,838 | 3,265 | 1,724 | 1,277 | 1,281 | 1,147 | 1,263 | 2,272 | 3,863 | 4,730 |
| 2019 | 5,527 | 5,760 | 4,460 | 2,214 | 1,865 | 1,288 | 1,273 | 1,176 | 1,063 | 1,973 | 4,437 | 4,351 |
| 2020 | 5,268 | 4,731 | 3,389 | 2,213 | 1,537 | 1,356 | 1,220 | 1,253 | 1,193 | 1,891 | 2,950 | 4,599 |
| 2021 | 5,125 | 6,076 | 3,302 | 2,099 | 1,498 | 1,586 | 1,256 | 1,142 | 1,188 | 1,478 | 2,945 | 4,127 |
| 2022 | 5,294 | 4,492 | 3,785 | 2,563 | 1,787 | 1,385 | 1,156 | 1,014 | 972 | 1,694 | 3,295 | 5,273 |
| 2023 | 5,528 | 4,823 | 4,357 | 2,611 | 1,682 | 1,488 | 1,369 | 1,176 | 1,253 | 2,296 | 3,197 | 4,427 |
| 2024 | 6,102 | 3,653 | 3,447 | 2,217 | 1,720 | 1,480 | 1,357 | 1,195 | 1,292 | 1,921 | 3,157 | 4,850 |
| 2025 | 5,813 | 5,361 | 3,373 | 2,245 | 1,651 | 1,410 | 1,344 | 1,240 | 1,245 | 1,617 | 2,984 | 4,440 |
| 2026 | 5,383 | 3,525 | 2,987 | 2,236 | ||||||||
| - = No Data Reported; -- = Not Applicable; NA = Not Available; W = Withheld to avoid disclosure of individual company data. |
| Release Date: 6/30/2026 |
| Next Release Date: 7/31/2026 |