|
Download Data (XLS File) |
|
||||||||
|
||||||||
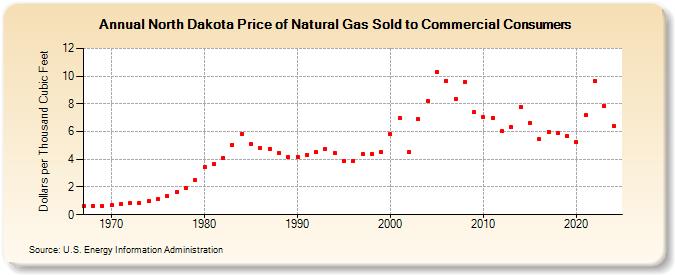
| North Dakota Price of Natural Gas Sold to Commercial Consumers (Dollars per Thousand Cubic Feet) | ||||||||
| Decade | Year-0 | Year-1 | Year-2 | Year-3 | Year-4 | Year-5 | Year-6 | Year-7 | Year-8 | Year-9 |
|---|---|---|---|---|---|---|---|---|---|---|
| 1960's | 0.62 | 0.64 | 0.64 | |||||||
| 1970's | 0.69 | 0.76 | 0.81 | 0.87 | 1.00 | 1.11 | 1.35 | 1.67 | 1.94 | 2.47 |
| 1980's | 3.43 | 3.65 | 4.10 | 5.06 | 5.85 | 5.11 | 4.79 | 4.75 | 4.48 | 4.19 |
| 1990's | 4.19 | 4.34 | 4.52 | 4.75 | 4.48 | 3.90 | 3.91 | 4.35 | 4.37 | 4.51 |
| 2000's | 5.80 | 6.96 | 4.54 | 6.89 | 8.21 | 10.33 | 9.68 | 8.37 | 9.58 | 7.41 |
| 2010's | 7.03 | 7.00 | 6.04 | 6.32 | 7.74 | 6.62 | 5.45 | 6.00 | 5.90 | 5.67 |
| 2020's | 5.26 | 7.19 | 9.62 | 7.87 | 6.41 | 7.14 |
| - = No Data Reported; -- = Not Applicable; NA = Not Available; W = Withheld to avoid disclosure of individual company data. |
| Release Date: 6/30/2026 |
| Next Release Date: 7/31/2026 |