|
Download Data (XLS File) |
|
||||||||
|
||||||||
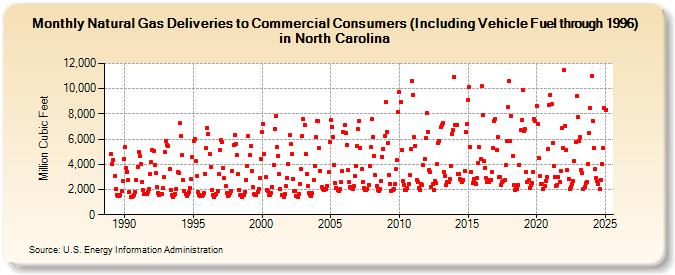
| Natural Gas Deliveries to Commercial Consumers (Including Vehicle Fuel through 1996) in North Carolina (Million Cubic Feet) | ||||||||
| Year | Jan | Feb | Mar | Apr | May | Jun | Jul | Aug | Sep | Oct | Nov | Dec |
|---|---|---|---|---|---|---|---|---|---|---|---|---|
| 1989 | 4,784 | 4,016 | 4,367 | 3,046 | 2,022 | 1,568 | 1,475 | 1,454 | 1,534 | 1,843 | 2,639 | 4,396 |
| 1990 | 5,379 | 3,690 | 3,400 | 2,747 | 1,820 | 1,445 | 1,394 | 1,480 | 1,596 | 1,795 | 2,715 | 3,817 |
| 1991 | 4,947 | 4,647 | 3,990 | 2,629 | 1,928 | 1,677 | 1,613 | 1,679 | 1,789 | 2,052 | 3,200 | 4,162 |
| 1992 | 5,169 | 5,066 | 3,983 | 3,296 | 2,205 | 1,733 | 1,591 | 1,607 | 1,679 | 2,138 | 3,010 | 4,941 |
| 1993 | 5,866 | 5,566 | 5,426 | 3,602 | 1,988 | 1,532 | 1,437 | 1,539 | 1,674 | 2,067 | 3,379 | 3,292 |
| 1994 | 7,247 | 6,269 | 4,727 | 2,761 | 1,844 | 1,605 | 1,487 | 1,647 | 1,831 | 2,115 | 2,817 | 4,592 |
| 1995 | 5,839 | 6,031 | 4,241 | 3,065 | 1,766 | 1,579 | 1,487 | 1,475 | 1,597 | 1,740 | 3,263 | 5,279 |
| 1996 | 6,913 | 6,421 | 4,851 | 3,760 | 1,970 | 1,586 | 1,415 | 1,575 | 1,658 | 1,917 | 3,240 | 5,160 |
| 1997 | 5,964 | 5,747 | 3,731 | 2,909 | 2,260 | 1,741 | 1,513 | 1,592 | 1,713 | 1,908 | 3,434 | 5,508 |
| 1998 | 6,324 | 5,635 | 4,732 | 3,222 | 1,975 | 1,583 | 1,437 | 1,571 | 1,594 | 1,767 | 2,741 | 3,847 |
| 1999 | 6,259 | 4,724 | 5,456 | 3,497 | 2,167 | 1,655 | 1,545 | 1,554 | 1,806 | 2,074 | 2,876 | 4,405 |
| 2000 | 6,530 | 7,211 | 4,836 | 2,967 | 1,924 | 1,897 | 1,529 | 1,542 | 1,695 | 2,192 | 3,964 | 6,824 |
| 2001 | 7,812 | 5,397 | 4,696 | 3,203 | 2,024 | 1,564 | 1,569 | 1,445 | 1,626 | 2,264 | 2,946 | 4,038 |
| 2002 | 6,314 | 5,606 | 4,787 | 2,861 | 1,902 | 1,882 | 1,511 | 1,437 | 1,624 | 2,429 | 3,620 | 6,225 |
| 2003 | 7,576 | 7,127 | 4,812 | 3,255 | 2,268 | 1,693 | 1,560 | 1,521 | 1,698 | 2,758 | 3,854 | 6,140 |
| 2004 | 7,463 | 7,438 | 5,282 | 3,483 | 2,214 | 2,035 | 1,949 | 2,038 | 2,017 | 2,305 | 3,377 | 5,782 |
| 2005 | 7,551 | 6,951 | 6,156 | 3,951 | 2,488 | 2,108 | 1,958 | 1,889 | 2,026 | 2,564 | 3,466 | 6,590 |
| 2006 | 7,102 | 6,464 | 5,564 | 3,540 | 2,561 | 2,232 | 2,138 | 2,008 | 2,285 | 3,093 | 3,884 | 5,449 |
| 2007 | 6,772 | 7,443 | 5,270 | 3,597 | 2,602 | 2,131 | 1,997 | 1,965 | 2,068 | 2,352 | 3,902 | 5,335 |
| 2008 | 7,577 | 6,186 | 4,686 | 3,120 | 2,280 | 1,998 | 1,909 | 2,010 | 2,707 | 4,602 | 5,251 | 6,241 |
| 2009 | 8,960 | 6,565 | 5,670 | 3,161 | 2,464 | 1,853 | 1,983 | 2,064 | 2,450 | 3,598 | 4,375 | 8,161 |
| 2010 | 9,701 | 8,911 | 5,153 | 2,691 | 2,389 | 1,977 | 1,926 | 2,092 | 2,433 | 3,117 | 5,190 | 10,645 |
| 2011 | 9,522 | 6,169 | 5,460 | 2,761 | 2,568 | 2,133 | 1,980 | 2,465 | 2,382 | 3,931 | 4,446 | 6,081 |
| 2012 | 8,072 | 6,583 | 3,545 | 3,370 | 2,205 | 2,433 | 1,976 | 2,673 | 2,529 | 4,003 | 5,686 | 5,878 |
| 2013 | 6,935 | 7,155 | 7,253 | 3,390 | 3,075 | 2,381 | 2,613 | 2,611 | 2,873 | 3,869 | 6,415 | 6,700 |
| 2014 | 10,966 | 7,128 | 7,155 | 3,247 | 3,196 | 2,826 | 2,785 | 2,602 | 2,779 | 3,474 | 6,594 | 7,192 |
| 2015 | 9,139 | 10,110 | 5,408 | 3,421 | 2,488 | 2,867 | 2,487 | 2,452 | 2,889 | 4,116 | 5,334 | 4,403 |
| 2016 | 10,183 | 7,910 | 4,281 | 3,743 | 2,879 | 2,583 | 2,585 | 2,791 | 2,792 | 3,360 | 5,301 | 7,468 |
| 2017 | 7,633 | 5,153 | 6,205 | 2,997 | 3,008 | 2,394 | 2,628 | 2,709 | 2,763 | 3,906 | 5,821 | 8,508 |
| 2018 | 10,627 | 5,830 | 7,814 | 4,621 | 2,338 | 1,996 | 2,104 | 2,077 | 2,373 | 3,967 | 6,696 | 7,544 |
| 2019 | 9,858 | 6,619 | 6,767 | 3,392 | 2,600 | 2,758 | 2,145 | 2,326 | 2,478 | 3,350 | 7,558 | 7,461 |
| 2020 | 8,651 | 7,216 | 4,524 | 3,071 | 2,421 | 2,407 | 2,005 | 2,251 | 2,687 | 2,996 | 5,253 | 8,701 |
| 2021 | 9,522 | 8,760 | 5,682 | 3,869 | 2,986 | 2,304 | 2,367 | 2,976 | 2,566 | 3,496 | 6,859 | 5,331 |
| 2022 | 11,455 | 7,039 | 5,162 | 3,527 | 2,870 | 2,047 | 2,193 | 2,453 | 2,681 | 4,267 | 5,740 | 9,411 |
| 2023 | 7,755 | 5,817 | 6,136 | 3,546 | 3,277 | 2,045 | 2,202 | 2,496 | 2,627 | 4,046 | 6,483 | 8,431 |
| 2024 | 12,867 | 8,710 | 6,167 | 4,230 | 3,352 | 3,106 | 2,848 | 2,345 | 3,253 | 4,726 | 6,151 | 9,877 |
| 2025 | 13,622 | 9,693 | 6,365 | 4,535 | 3,891 | 3,005 | 3,064 | 3,319 | 3,506 | 5,311 | 6,083 | 10,460 |
| 2026 | 12,498 | 5,582 | 5,777 | 3,843 | ||||||||
| - = No Data Reported; -- = Not Applicable; NA = Not Available; W = Withheld to avoid disclosure of individual company data. |
| Release Date: 6/30/2026 |
| Next Release Date: 7/31/2026 |