|
Download Data (XLS File) |
|
||||||||
|
||||||||
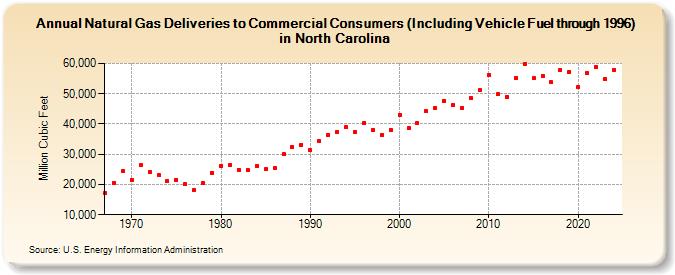
| Natural Gas Deliveries to Commercial Consumers (Including Vehicle Fuel through 1996) in North Carolina (Million Cubic Feet) | ||||||||
| Decade | Year-0 | Year-1 | Year-2 | Year-3 | Year-4 | Year-5 | Year-6 | Year-7 | Year-8 | Year-9 |
|---|---|---|---|---|---|---|---|---|---|---|
| 1960's | 17,100 | 20,624 | 24,524 | |||||||
| 1970's | 21,532 | 26,331 | 24,200 | 23,044 | 21,002 | 21,615 | 20,042 | 18,303 | 20,366 | 23,916 |
| 1980's | 26,172 | 26,367 | 24,891 | 24,705 | 26,174 | 25,029 | 25,474 | 30,010 | 32,464 | 33,145 |
| 1990's | 31,277 | 34,313 | 36,418 | 37,370 | 38,940 | 37,362 | 40,467 | 38,021 | 36,427 | 38,019 |
| 2000's | 43,113 | 38,583 | 40,198 | 44,262 | 45,383 | 47,696 | 46,321 | 45,434 | 48,567 | 51,303 |
| 2010's | 56,225 | 49,898 | 48,951 | 55,271 | 59,945 | 55,114 | 55,876 | 53,726 | 57,989 | 57,310 |
| 2020's | 52,183 | 56,718 | 58,844 | 54,862 | 67,631 | 72,852 |
| - = No Data Reported; -- = Not Applicable; NA = Not Available; W = Withheld to avoid disclosure of individual company data. |
| Release Date: 6/30/2026 |
| Next Release Date: 7/31/2026 |