|
Download Data (XLS File) |
|
||||||||
|
||||||||
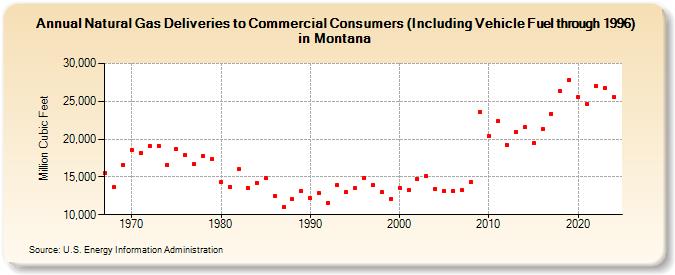
| Natural Gas Deliveries to Commercial Consumers (Including Vehicle Fuel through 1996) in Montana (Million Cubic Feet) | ||||||||
| Decade | Year-0 | Year-1 | Year-2 | Year-3 | Year-4 | Year-5 | Year-6 | Year-7 | Year-8 | Year-9 |
|---|---|---|---|---|---|---|---|---|---|---|
| 1960's | 15,516 | 13,651 | 16,593 | |||||||
| 1970's | 18,564 | 18,109 | 19,151 | 19,143 | 16,602 | 18,654 | 17,831 | 16,706 | 17,766 | 17,396 |
| 1980's | 14,265 | 13,725 | 15,987 | 13,534 | 14,256 | 14,820 | 12,536 | 10,989 | 12,041 | 13,141 |
| 1990's | 12,164 | 12,846 | 11,557 | 13,880 | 12,981 | 13,489 | 14,823 | 13,911 | 12,952 | 12,088 |
| 2000's | 13,533 | 13,245 | 14,704 | 15,119 | 13,407 | 13,136 | 13,181 | 13,223 | 14,340 | 23,575 |
| 2010's | 20,459 | 22,336 | 19,205 | 20,971 | 21,549 | 19,502 | 21,314 | 23,374 | 26,308 | 27,790 |
| 2020's | 25,598 | 24,668 | 27,067 | 26,778 | 25,671 | 25,308 |
| - = No Data Reported; -- = Not Applicable; NA = Not Available; W = Withheld to avoid disclosure of individual company data. |
| Release Date: 6/30/2026 |
| Next Release Date: 7/31/2026 |