|
Download Data (XLS File) |
|
||||||||
|
||||||||
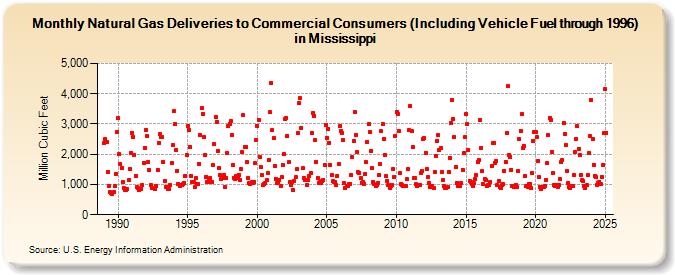
| Natural Gas Deliveries to Commercial Consumers (Including Vehicle Fuel through 1996) in Mississippi (Million Cubic Feet) | ||||||||
| Year | Jan | Feb | Mar | Apr | May | Jun | Jul | Aug | Sep | Oct | Nov | Dec |
|---|---|---|---|---|---|---|---|---|---|---|---|---|
| 1989 | 2,372 | 2,502 | 2,411 | 1,407 | 947 | 739 | 718 | 701 | 754 | 939 | 1,350 | 2,727 |
| 1990 | 3,199 | 2,007 | 1,675 | 1,541 | 1,070 | 884 | 819 | 818 | 841 | 1,137 | 1,508 | 2,050 |
| 1991 | 2,704 | 2,572 | 1,977 | 1,291 | 901 | 875 | 806 | 834 | 865 | 989 | 1,721 | 2,208 |
| 1992 | 2,817 | 2,595 | 1,758 | 1,473 | 994 | 888 | 885 | 867 | 847 | 942 | 1,489 | 2,387 |
| 1993 | 2,663 | 2,583 | 2,559 | 1,756 | 1,108 | 925 | 904 | 864 | 843 | 985 | 1,710 | 2,298 |
| 1994 | 3,417 | 2,993 | 2,136 | 1,456 | 1,012 | 942 | 992 | 973 | 1,000 | 1,050 | 1,280 | 1,981 |
| 1995 | 2,945 | 2,809 | 2,252 | 1,295 | 1,070 | 1,074 | 902 | 1,202 | 1,023 | 1,013 | 1,693 | 2,627 |
| 1996 | 3,525 | 3,345 | 2,558 | 1,987 | 1,256 | 1,069 | 1,156 | 1,198 | 1,078 | 1,088 | 1,631 | 2,333 |
| 1997 | 3,242 | 3,075 | 2,114 | 1,532 | 1,305 | 1,174 | 1,206 | 1,309 | 924 | 1,224 | 2,027 | 2,937 |
| 1998 | 3,011 | 3,114 | 2,635 | 1,645 | 1,229 | 1,192 | 1,265 | 1,198 | 1,327 | 1,155 | 1,512 | 2,075 |
| 1999 | 3,294 | 2,251 | 2,243 | 1,748 | 1,215 | 1,054 | 1,028 | 1,071 | 1,055 | 1,086 | 1,699 | 2,464 |
| 2000 | 2,939 | 3,128 | 1,920 | 1,590 | 1,314 | 998 | 1,029 | 1,038 | 1,143 | 1,368 | 1,824 | 3,382 |
| 2001 | 4,353 | 2,794 | 2,540 | 1,613 | 1,194 | 1,037 | 1,078 | 1,143 | 935 | 1,234 | 1,659 | 2,005 |
| 2002 | 3,155 | 3,212 | 2,610 | 1,730 | 1,076 | 983 | 1,096 | 808 | 1,114 | 1,233 | 1,503 | 2,698 |
| 2003 | 3,682 | 3,844 | 2,876 | 1,530 | 1,218 | 1,138 | 1,146 | 995 | 1,141 | 1,274 | 1,388 | 2,702 |
| 2004 | 3,370 | 3,249 | 2,457 | 1,747 | 1,209 | 1,049 | 1,086 | 1,062 | 1,117 | 1,156 | 1,660 | 2,968 |
| 2005 | 2,548 | 2,844 | 2,383 | 1,646 | 1,321 | 1,100 | 1,083 | 1,082 | 977 | 1,293 | 1,666 | 2,938 |
| 2006 | 2,762 | 2,709 | 2,464 | 1,045 | 872 | 946 | 946 | 1,024 | 1,027 | 1,300 | 1,895 | 2,434 |
| 2007 | 3,400 | 2,641 | 2,072 | 1,401 | 1,381 | 1,204 | 1,065 | 1,072 | 1,032 | 1,362 | 1,729 | 2,416 |
| 2008 | 2,990 | 2,733 | 2,100 | 1,544 | 1,083 | 1,000 | 960 | 994 | 1,053 | 1,307 | 1,662 | 2,756 |
| 2009 | 3,002 | 2,497 | 1,982 | 1,281 | 1,125 | 991 | 896 | 948 | 986 | 1,516 | 1,256 | 2,613 |
| 2010 | 3,394 | 3,334 | 2,767 | 1,374 | 1,032 | 990 | 940 | 950 | 940 | 1,172 | 1,499 | 2,786 |
| 2011 | 3,593 | 2,765 | 2,239 | 1,226 | 1,207 | 1,005 | 937 | 992 | 993 | 1,366 | 1,435 | 2,490 |
| 2012 | 2,532 | 2,054 | 1,499 | 1,238 | 1,043 | 932 | 922 | 955 | 882 | 1,408 | 1,937 | 2,433 |
| 2013 | 2,622 | 2,156 | 2,200 | 1,415 | 1,132 | 934 | 868 | 899 | 910 | 1,418 | 1,891 | 3,038 |
| 2014 | 3,807 | 3,174 | 2,572 | 1,571 | 1,065 | 950 | 972 | 956 | 1,033 | 1,488 | 2,033 | 2,574 |
| 2015 | 3,332 | 3,007 | 2,148 | 1,130 | 1,068 | 1,015 | 961 | 1,046 | 1,169 | 1,304 | 1,744 | 1,803 |
| 2016 | 3,137 | 2,208 | 1,435 | 1,019 | 1,192 | 1,158 | 949 | 972 | 988 | 1,097 | 1,610 | 2,369 |
| 2017 | 2,374 | 1,704 | 1,776 | 987 | 1,101 | 903 | 893 | 979 | 1,011 | 1,461 | 1,758 | 2,697 |
| 2018 | 4,244 | 1,989 | 1,920 | 1,480 | 951 | 916 | 908 | 995 | 931 | 1,450 | 2,487 | 2,768 |
| 2019 | 3,327 | 2,200 | 2,266 | 1,291 | 945 | 920 | 1,008 | 1,022 | 873 | 1,384 | 2,451 | 2,721 |
| 2020 | 2,727 | 2,559 | 1,779 | 1,247 | 924 | 844 | 906 | 918 | 934 | 1,159 | 1,706 | 2,620 |
| 2021 | 3,194 | 3,144 | 2,087 | 1,363 | 987 | 940 | 969 | 921 | 979 | 1,174 | 1,728 | 1,796 |
| 2022 | 3,033 | 2,677 | 2,298 | 1,457 | 1,050 | 924 | 877 | 961 | 934 | 1,309 | 2,074 | 2,510 |
| 2023 | 2,952 | 2,195 | 1,996 | 1,321 | 1,159 | 1,110 | 961 | 889 | 977 | 1,324 | 2,045 | 2,615 |
| 2024 | 3,653 | 2,420 | 1,588 | 1,236 | 1,191 | 954 | 1,013 | 1,053 | 963 | 1,210 | 1,596 | 2,590 |
| 2025 | 3,964 | 2,603 | 1,833 | 1,272 | 1,635 | 824 | 936 | 772 | 1,016 | 1,309 | 1,724 | 2,749 |
| 2026 | 3,757 | 2,378 | 1,836 | 1,268 | ||||||||
| - = No Data Reported; -- = Not Applicable; NA = Not Available; W = Withheld to avoid disclosure of individual company data. |
| Release Date: 6/30/2026 |
| Next Release Date: 7/31/2026 |