|
Download Data (XLS File) |
|
||||||||
|
||||||||
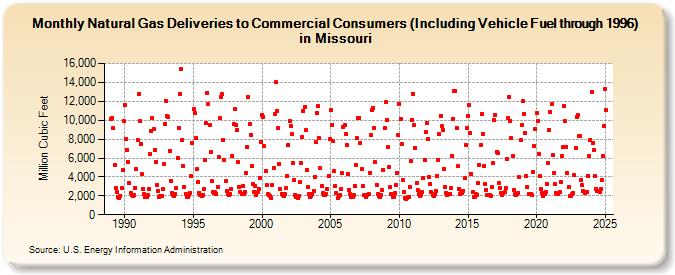
| Natural Gas Deliveries to Commercial Consumers (Including Vehicle Fuel through 1996) in Missouri (Million Cubic Feet) | ||||||||
| Year | Jan | Feb | Mar | Apr | May | Jun | Jul | Aug | Sep | Oct | Nov | Dec |
|---|---|---|---|---|---|---|---|---|---|---|---|---|
| 1989 | 10,118 | 10,280 | 9,192 | 5,246 | 2,799 | 2,359 | 1,829 | 1,780 | 2,021 | 2,798 | 4,716 | 9,903 |
| 1990 | 11,634 | 7,979 | 6,849 | 5,622 | 3,309 | 2,310 | 2,034 | 1,971 | 2,083 | 2,863 | 4,811 | 7,921 |
| 1991 | 12,748 | 9,932 | 7,479 | 4,261 | 2,760 | 2,181 | 1,853 | 1,896 | 2,056 | 2,689 | 6,471 | 8,864 |
| 1992 | 10,201 | 9,060 | 6,835 | 5,601 | 3,144 | 2,547 | 1,849 | 1,993 | 2,024 | 2,728 | 5,335 | 9,646 |
| 1993 | 12,062 | 10,467 | 10,336 | 6,750 | 3,580 | 2,266 | 2,066 | 1,959 | 2,222 | 2,864 | 5,974 | 9,124 |
| 1994 | 12,767 | 15,462 | 7,865 | 5,141 | 2,924 | 2,200 | 1,867 | 1,858 | 2,073 | 2,310 | 4,097 | 7,633 |
| 1995 | 11,186 | 10,770 | 8,096 | 4,806 | 3,512 | 2,326 | 2,050 | 2,019 | 2,119 | 2,756 | 5,747 | 9,698 |
| 1996 | 12,881 | 11,673 | 9,501 | 6,625 | 3,563 | 2,380 | 2,289 | 2,356 | 2,235 | 2,959 | 6,136 | 10,204 |
| 1997 | 12,455 | 12,741 | 7,929 | 5,758 | 3,554 | 2,457 | 2,168 | 2,062 | 2,194 | 2,739 | 6,189 | 9,581 |
| 1998 | 11,146 | 9,496 | 8,999 | 5,556 | 2,984 | 2,450 | 2,184 | 3,005 | 2,192 | 2,389 | 4,415 | 7,177 |
| 1999 | 12,432 | 9,629 | 8,471 | 5,187 | 3,214 | 2,427 | 3,012 | 2,034 | 2,367 | 2,751 | 3,894 | 7,682 |
| 2000 | 10,546 | 10,375 | 7,263 | 4,658 | 3,107 | 2,150 | 2,052 | 1,957 | 1,816 | 3,103 | 4,976 | 10,670 |
| 2001 | 14,006 | 10,971 | 9,208 | 5,397 | 2,699 | 2,198 | 2,040 | 1,977 | 2,152 | 2,787 | 4,083 | 7,407 |
| 2002 | 9,913 | 9,371 | 8,497 | 5,523 | 3,708 | 2,092 | 1,892 | 1,796 | 1,953 | 3,425 | 5,514 | 8,212 |
| 2003 | 10,989 | 11,402 | 8,956 | 4,766 | 2,974 | 2,147 | 1,867 | 2,023 | 2,198 | 2,505 | 4,030 | 7,658 |
| 2004 | 10,783 | 11,541 | 8,085 | 4,907 | 3,042 | 2,256 | 2,072 | 2,052 | 2,198 | 2,736 | 4,121 | 7,962 |
| 2005 | 11,063 | 9,540 | 7,767 | 4,578 | 3,028 | 2,296 | 1,737 | 1,980 | 2,071 | 2,668 | 4,382 | 9,261 |
| 2006 | 9,461 | 8,543 | 7,353 | 4,323 | 2,631 | 2,213 | 1,888 | 1,873 | 2,073 | 3,070 | 5,217 | 8,076 |
| 2007 | 10,205 | 10,285 | 7,619 | 4,839 | 3,015 | 2,083 | 2,091 | 1,889 | 2,103 | 2,224 | 4,439 | 8,432 |
| 2008 | 11,071 | 11,307 | 9,178 | 5,527 | 3,172 | 2,166 | 2,022 | 1,918 | 2,068 | 2,614 | 4,764 | 9,185 |
| 2009 | 11,890 | 10,027 | 7,208 | 5,038 | 2,894 | 2,201 | 1,901 | 1,920 | 2,321 | 3,170 | 4,459 | 8,405 |
| 2010 | 11,740 | 10,106 | 7,456 | 3,676 | 2,389 | 1,763 | 1,682 | 1,793 | 1,902 | 2,985 | 5,632 | 10,070 |
| 2011 | 12,757 | 9,446 | 7,058 | 3,352 | 2,618 | 2,188 | 2,015 | 2,079 | 2,450 | 3,839 | 5,794 | 8,708 |
| 2012 | 9,747 | 7,993 | 4,030 | 3,265 | 2,368 | 2,133 | 2,013 | 2,179 | 2,530 | 4,138 | 5,832 | 8,509 |
| 2013 | 10,478 | 9,373 | 8,936 | 4,855 | 2,898 | 2,257 | 2,044 | 2,243 | 2,220 | 2,846 | 6,202 | 10,172 |
| 2014 | 13,133 | 13,070 | 9,208 | 5,112 | 2,733 | 2,190 | 2,267 | 2,268 | 2,556 | 3,835 | 7,349 | 9,199 |
| 2015 | 10,496 | 11,594 | 8,620 | 4,330 | 2,368 | 1,840 | 1,881 | 2,161 | 2,112 | 3,331 | 5,298 | 7,357 |
| 2016 | 10,686 | 8,517 | 5,205 | 3,235 | 2,666 | 2,033 | 2,039 | 2,119 | 1,981 | 2,951 | 5,473 | 10,063 |
| 2017 | 10,590 | 6,673 | 6,534 | 3,318 | 2,851 | 2,248 | 2,089 | 2,290 | 2,361 | 2,812 | 5,864 | 10,274 |
| 2018 | 12,483 | 9,946 | 8,107 | 6,173 | 2,622 | 2,150 | 2,097 | 2,150 | 2,299 | 3,988 | 7,899 | 9,467 |
| 2019 | 11,989 | 10,638 | 8,697 | 4,082 | 2,947 | 2,215 | 2,201 | 2,208 | 2,130 | 4,475 | 7,255 | 9,092 |
| 2020 | 10,768 | 9,924 | 6,412 | 4,047 | 2,742 | 2,277 | 1,990 | 2,150 | 2,357 | 3,294 | 5,490 | 8,965 |
| 2021 | 10,911 | 11,763 | 6,321 | 4,416 | 3,221 | 2,252 | 2,163 | 2,185 | 2,373 | 3,469 | 6,245 | 7,132 |
| 2022 | 11,552 | 9,873 | 7,210 | 4,380 | 2,952 | 1,996 | 2,030 | 2,189 | 2,275 | 4,197 | 7,021 | 10,298 |
| 2023 | 10,497 | 8,259 | 8,278 | 3,697 | 3,147 | 2,493 | 2,293 | 2,408 | 2,458 | 4,119 | 6,190 | 7,930 |
| 2024 | 12,232 | 7,178 | 6,516 | 3,863 | 2,608 | 2,348 | 2,333 | 2,273 | 2,533 | 3,440 | 5,841 | 8,855 |
| 2025 | 13,237 | 10,983 | 7,901 | 4,156 | 2,895 | 2,239 | 2,352 | 2,277 | 2,546 | 3,616 | 6,470 | 9,723 |
| 2026 | 12,722 | 7,937 | 5,743 | 3,240 | ||||||||
| - = No Data Reported; -- = Not Applicable; NA = Not Available; W = Withheld to avoid disclosure of individual company data. |
| Release Date: 6/30/2026 |
| Next Release Date: 7/31/2026 |