|
Download Data (XLS File) |
|
||||||||
|
||||||||
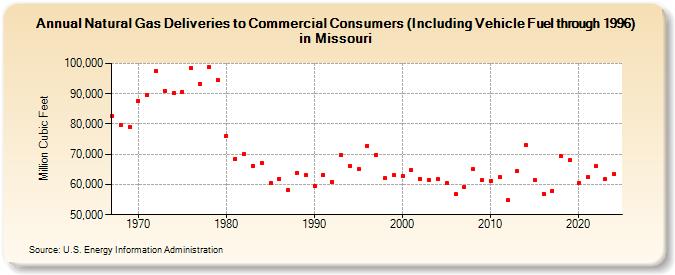
| Natural Gas Deliveries to Commercial Consumers (Including Vehicle Fuel through 1996) in Missouri (Million Cubic Feet) | ||||||||
| Decade | Year-0 | Year-1 | Year-2 | Year-3 | Year-4 | Year-5 | Year-6 | Year-7 | Year-8 | Year-9 |
|---|---|---|---|---|---|---|---|---|---|---|
| 1960's | 82,524 | 79,821 | 79,019 | |||||||
| 1970's | 87,644 | 89,534 | 97,506 | 91,038 | 90,291 | 90,719 | 98,435 | 93,323 | 98,680 | 94,629 |
| 1980's | 76,054 | 68,455 | 69,913 | 66,106 | 67,218 | 60,345 | 61,890 | 58,205 | 63,839 | 63,039 |
| 1990's | 59,387 | 63,191 | 60,963 | 69,670 | 66,196 | 65,086 | 72,802 | 69,829 | 61,995 | 63,100 |
| 2000's | 62,673 | 64,924 | 61,897 | 61,516 | 61,755 | 60,369 | 56,722 | 59,224 | 64,993 | 61,433 |
| 2010's | 61,194 | 62,304 | 54,736 | 64,522 | 72,919 | 61,389 | 56,968 | 57,903 | 69,381 | 67,930 |
| 2020's | 60,417 | 62,452 | 65,972 | 61,768 | 60,020 | 68,395 |
| - = No Data Reported; -- = Not Applicable; NA = Not Available; W = Withheld to avoid disclosure of individual company data. |
| Release Date: 6/30/2026 |
| Next Release Date: 7/31/2026 |