|
Download Data (XLS File) |
|
||||||||
|
||||||||
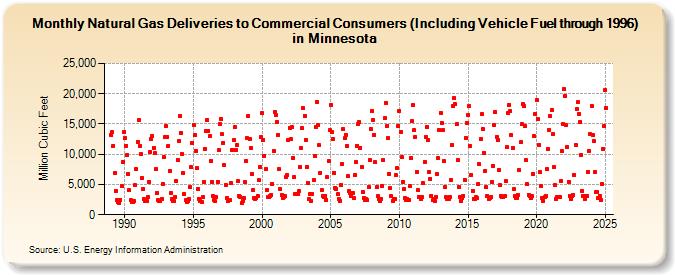
| Natural Gas Deliveries to Commercial Consumers (Including Vehicle Fuel through 1996) in Minnesota (Million Cubic Feet) | ||||||||
| Year | Jan | Feb | Mar | Apr | May | Jun | Jul | Aug | Sep | Oct | Nov | Dec |
|---|---|---|---|---|---|---|---|---|---|---|---|---|
| 1989 | 13,112 | 13,607 | 11,411 | 6,916 | 3,980 | 2,416 | 2,112 | 2,011 | 2,475 | 4,718 | 8,764 | 13,661 |
| 1990 | 12,696 | 11,412 | 9,846 | 6,734 | 4,032 | 2,369 | 2,100 | 2,060 | 2,342 | 4,865 | 7,491 | 12,066 |
| 1991 | 15,649 | 11,426 | 10,026 | 6,092 | 4,220 | 2,541 | 2,315 | 2,304 | 2,930 | 5,399 | 10,392 | 12,580 |
| 1992 | 13,000 | 11,075 | 10,134 | 7,517 | 3,602 | 2,467 | 2,244 | 2,296 | 2,631 | 5,092 | 9,526 | 12,795 |
| 1993 | 14,685 | 12,874 | 11,396 | 7,267 | 3,588 | 2,549 | 2,190 | 2,207 | 2,952 | 5,614 | 9,104 | 12,205 |
| 1994 | 16,282 | 13,583 | 10,030 | 6,927 | 3,461 | 2,365 | 2,069 | 2,295 | 2,615 | 4,582 | 7,844 | 11,880 |
| 1995 | 14,797 | 13,146 | 10,569 | 7,759 | 4,303 | 2,618 | 2,212 | 2,156 | 2,864 | 5,456 | 10,937 | 13,839 |
| 1996 | 15,692 | 13,918 | 12,931 | 8,798 | 5,383 | 3,072 | 2,377 | 2,254 | 2,867 | 5,479 | 10,756 | 15,009 |
| 1997 | 15,781 | 13,278 | 11,911 | 8,158 | 4,947 | 2,800 | 2,342 | 2,369 | 2,407 | 5,178 | 10,717 | 12,344 |
| 1998 | 14,444 | 10,777 | 11,517 | 5,531 | 3,171 | 2,992 | 2,003 | 2,289 | 2,717 | 5,356 | 8,896 | 12,652 |
| 1999 | 16,281 | 12,553 | 11,068 | 6,697 | 4,012 | 2,690 | 2,602 | 2,703 | 3,128 | 5,681 | 7,856 | 12,790 |
| 2000 | 16,792 | 12,386 | 9,779 | 7,580 | 4,054 | 2,954 | 2,964 | 3,053 | 3,246 | 5,075 | 10,570 | 16,905 |
| 2001 | 16,467 | 15,361 | 13,183 | 7,534 | 4,204 | 3,210 | 2,807 | 3,002 | 3,048 | 6,185 | 6,546 | 12,297 |
| 2002 | 14,400 | 12,438 | 14,535 | 9,410 | 6,213 | 3,445 | 3,368 | 3,481 | 3,845 | 7,905 | 11,035 | 14,311 |
| 2003 | 17,576 | 16,340 | 12,370 | 7,958 | 5,316 | 2,562 | 3,486 | 2,318 | 3,476 | 5,728 | 9,741 | 14,576 |
| 2004 | 18,700 | 14,800 | 11,455 | 6,958 | 4,114 | 3,086 | 2,870 | 3,047 | 2,506 | 6,225 | 8,843 | 13,937 |
| 2005 | 18,205 | 13,683 | 12,586 | 6,947 | 4,475 | 4,253 | 3,360 | 2,576 | 2,299 | 4,948 | 8,445 | 14,139 |
| 2006 | 12,605 | 13,221 | 11,409 | 6,329 | 3,889 | 3,637 | 3,018 | 3,510 | 2,801 | 6,584 | 8,732 | 11,435 |
| 2007 | 15,044 | 15,299 | 11,083 | 7,904 | 3,763 | 2,812 | 2,498 | 2,604 | 2,462 | 4,559 | 9,072 | 14,176 |
| 2008 | 17,112 | 15,667 | 13,243 | 8,654 | 4,544 | 3,046 | 2,647 | 2,198 | 2,612 | 4,807 | 9,016 | 15,979 |
| 2009 | 18,479 | 14,610 | 12,620 | 6,736 | 4,400 | 3,018 | 2,322 | 2,516 | 2,637 | 6,519 | 7,773 | 14,589 |
| 2010 | 17,216 | 13,730 | 9,504 | 5,432 | 4,261 | 2,810 | 2,354 | 2,599 | 2,488 | 4,784 | 9,338 | 15,446 |
| 2011 | 18,087 | 13,957 | 12,873 | 7,090 | 4,098 | 2,974 | 2,965 | 2,635 | 2,846 | 5,181 | 8,776 | 12,876 |
| 2012 | 14,544 | 12,270 | 7,092 | 5,974 | 3,169 | 2,365 | 2,565 | 2,231 | 2,969 | 6,660 | 9,299 | 14,035 |
| 2013 | 16,873 | 15,155 | 13,958 | 8,809 | 4,619 | 2,900 | 2,613 | 2,615 | 3,010 | 5,755 | 11,586 | 18,044 |
| 2014 | 19,277 | 18,236 | 14,952 | 9,085 | 4,546 | 2,862 | 2,349 | 2,755 | 3,102 | 5,816 | 12,705 | 15,199 |
| 2015 | 16,471 | 17,900 | 11,399 | 6,600 | 3,970 | 2,609 | 2,516 | 2,884 | 2,760 | 5,158 | 8,304 | 12,435 |
| 2016 | 16,600 | 14,112 | 10,263 | 7,290 | 4,573 | 3,075 | 2,674 | 2,840 | 2,948 | 5,391 | 8,031 | 14,792 |
| 2017 | 16,944 | 12,894 | 12,307 | 7,465 | 4,852 | 3,116 | 2,859 | 2,865 | 3,065 | 5,491 | 11,139 | 16,760 |
| 2018 | 18,203 | 17,065 | 13,168 | 11,054 | 4,263 | 3,126 | 2,844 | 2,827 | 3,252 | 7,360 | 11,941 | 14,923 |
| 2019 | 18,276 | 17,937 | 14,622 | 9,026 | 5,024 | 3,265 | 3,036 | 2,778 | 3,027 | 6,791 | 12,956 | 16,690 |
| 2020 | 18,888 | 15,816 | 11,600 | 7,000 | 4,703 | 2,803 | 2,301 | 2,914 | 3,122 | 7,521 | 10,874 | 13,974 |
| 2021 | 16,242 | 17,293 | 13,365 | 7,870 | 4,898 | 2,596 | 2,942 | 2,999 | 3,007 | 5,572 | 10,456 | 14,954 |
| 2022 | 20,755 | 19,551 | 14,764 | 11,217 | 5,461 | 3,140 | 2,678 | 3,143 | 3,298 | 6,583 | 11,561 | 17,404 |
| 2023 | 18,562 | 16,659 | 15,376 | 9,954 | 3,956 | 3,139 | 2,627 | 3,102 | 3,056 | 7,032 | 10,580 | 13,271 |
| 2024 | 17,893 | 13,142 | 12,047 | 7,065 | 3,676 | 3,664 | 2,830 | 3,153 | 2,342 | 5,128 | 10,868 | 14,625 |
| 2025 | 20,654 | 17,778 | 11,689 | 7,967 | 5,807 | 3,063 | 3,021 | 2,820 | 3,150 | 5,967 | 9,991 | 17,644 |
| 2026 | 21,946 | 15,302 | 12,733 | 8,315 | ||||||||
| - = No Data Reported; -- = Not Applicable; NA = Not Available; W = Withheld to avoid disclosure of individual company data. |
| Release Date: 6/30/2026 |
| Next Release Date: 7/31/2026 |