|
Download Data (XLS File) |
|
||||||||
|
||||||||
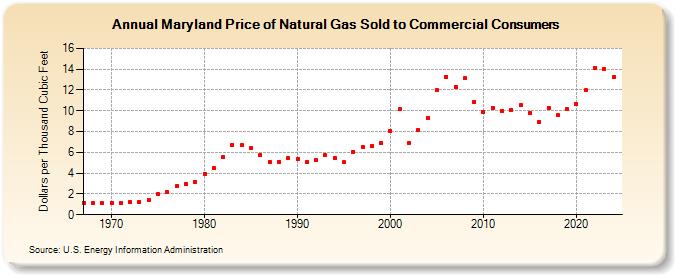
| Maryland Price of Natural Gas Sold to Commercial Consumers (Dollars per Thousand Cubic Feet) | ||||||||
| Decade | Year-0 | Year-1 | Year-2 | Year-3 | Year-4 | Year-5 | Year-6 | Year-7 | Year-8 | Year-9 |
|---|---|---|---|---|---|---|---|---|---|---|
| 1960's | 1.16 | 1.13 | 1.11 | |||||||
| 1970's | 1.11 | 1.15 | 1.22 | 1.26 | 1.43 | 1.99 | 2.16 | 2.72 | 2.96 | 3.17 |
| 1980's | 3.96 | 4.48 | 5.55 | 6.71 | 6.66 | 6.38 | 5.74 | 5.10 | 5.09 | 5.43 |
| 1990's | 5.35 | 5.04 | 5.24 | 5.72 | 5.46 | 5.06 | 6.08 | 6.52 | 6.64 | 6.94 |
| 2000's | 8.08 | 10.15 | 6.90 | 8.12 | 9.33 | 11.97 | 13.28 | 12.30 | 13.12 | 10.87 |
| 2010's | 9.87 | 10.29 | 10.00 | 10.06 | 10.52 | 9.80 | 8.94 | 10.27 | 9.57 | 10.14 |
| 2020's | 10.62 | 11.97 | 14.12 | 14.03 | 13.12 | NA |
| - = No Data Reported; -- = Not Applicable; NA = Not Available; W = Withheld to avoid disclosure of individual company data. |
| Release Date: 6/30/2026 |
| Next Release Date: 7/31/2026 |