|
Download Data (XLS File) |
|
||||||||
|
||||||||
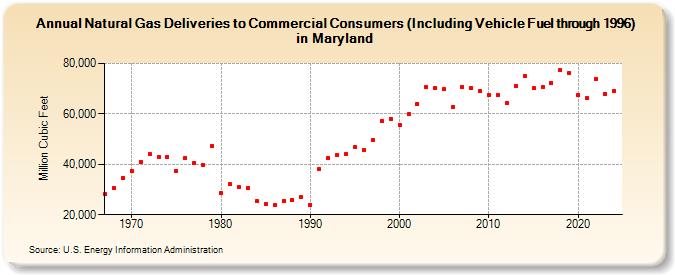
| Natural Gas Deliveries to Commercial Consumers (Including Vehicle Fuel through 1996) in Maryland (Million Cubic Feet) | ||||||||
| Decade | Year-0 | Year-1 | Year-2 | Year-3 | Year-4 | Year-5 | Year-6 | Year-7 | Year-8 | Year-9 |
|---|---|---|---|---|---|---|---|---|---|---|
| 1960's | 28,154 | 30,419 | 34,674 | |||||||
| 1970's | 37,529 | 40,988 | 43,950 | 42,953 | 43,080 | 37,466 | 42,422 | 40,532 | 39,821 | 47,326 |
| 1980's | 28,576 | 32,055 | 30,871 | 30,758 | 25,299 | 24,134 | 23,816 | 25,544 | 25,879 | 26,920 |
| 1990's | 24,051 | 38,117 | 42,464 | 43,635 | 44,136 | 46,874 | 45,842 | 49,802 | 57,370 | 58,103 |
| 2000's | 55,669 | 59,802 | 63,999 | 70,557 | 70,195 | 69,718 | 62,868 | 70,852 | 70,411 | 69,119 |
| 2010's | 67,555 | 67,505 | 64,146 | 71,145 | 74,843 | 70,199 | 70,500 | 72,279 | 77,310 | 76,349 |
| 2020's | 67,563 | 66,202 | 73,916 | 67,958 | 69,167 | 75,349 |
| - = No Data Reported; -- = Not Applicable; NA = Not Available; W = Withheld to avoid disclosure of individual company data. |
| Release Date: 6/30/2026 |
| Next Release Date: 7/31/2026 |