|
Download Data (XLS File) |
|
||||||||
|
||||||||
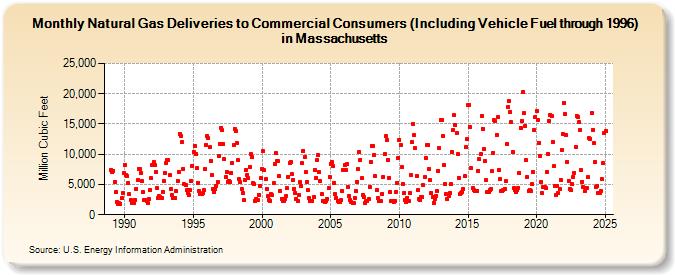
| Natural Gas Deliveries to Commercial Consumers (Including Vehicle Fuel through 1996) in Massachusetts (Million Cubic Feet) | ||||||||
| Year | Jan | Feb | Mar | Apr | May | Jun | Jul | Aug | Sep | Oct | Nov | Dec |
|---|---|---|---|---|---|---|---|---|---|---|---|---|
| 1989 | 7,394 | 6,984 | 7,234 | 5,392 | 3,703 | 2,150 | 1,726 | 1,894 | 1,799 | 2,720 | 3,647 | 6,864 |
| 1990 | 8,247 | 6,548 | 6,367 | 5,235 | 3,381 | 2,491 | 2,009 | 2,040 | 1,906 | 2,416 | 4,275 | 5,704 |
| 1991 | 7,617 | 7,579 | 6,948 | 5,504 | 3,772 | 2,466 | 2,435 | 2,188 | 1,939 | 2,666 | 4,048 | 6,027 |
| 1992 | 8,184 | 8,736 | 8,217 | 7,049 | 4,450 | 2,768 | 3,072 | 2,884 | 2,753 | 3,776 | 5,530 | 6,933 |
| 1993 | 8,556 | 9,118 | 9,026 | 6,491 | 4,195 | 3,184 | 2,692 | 2,802 | 2,766 | 3,878 | 5,622 | 7,098 |
| 1994 | 13,386 | 13,090 | 12,019 | 7,582 | 5,003 | 4,950 | 4,016 | 3,557 | 3,239 | 4,029 | 5,534 | 8,131 |
| 1995 | 10,442 | 11,385 | 10,005 | 7,717 | 5,319 | 3,930 | 3,386 | 3,344 | 3,525 | 4,026 | 7,597 | 11,594 |
| 1996 | 13,018 | 12,641 | 11,148 | 8,955 | 6,555 | 4,176 | 3,751 | 4,274 | 4,767 | 5,432 | 9,718 | 11,752 |
| 1997 | 14,376 | 13,958 | 11,697 | 9,132 | 6,215 | 7,023 | 5,442 | 5,635 | 5,364 | 6,898 | 8,546 | 11,528 |
| 1998 | 14,136 | 13,826 | 11,907 | 9,039 | 5,846 | 5,336 | 4,264 | 3,606 | 2,359 | 5,698 | 7,440 | 6,635 |
| 1999 | 6,013 | 7,931 | 9,984 | 9,484 | 5,215 | 5,006 | 2,243 | 2,622 | 2,443 | 3,315 | 4,813 | 6,067 |
| 2000 | 7,625 | 10,477 | 7,378 | 5,889 | 4,325 | 3,060 | 2,503 | 2,318 | 3,414 | 3,243 | 5,170 | 8,390 |
| 2001 | 10,123 | 8,942 | 8,810 | 6,323 | 3,897 | 2,651 | 2,264 | 2,290 | 2,668 | 3,061 | 4,369 | 6,278 |
| 2002 | 8,554 | 8,733 | 6,764 | 5,778 | 4,332 | 3,632 | 2,663 | 2,311 | 3,293 | 5,366 | 4,825 | 8,514 |
| 2003 | 10,615 | 9,578 | 6,993 | 5,454 | 4,044 | 2,751 | 2,229 | 2,308 | 2,267 | 2,881 | 7,354 | 6,116 |
| 2004 | 9,040 | 9,797 | 7,000 | 5,509 | 3,416 | 2,304 | 2,296 | 2,032 | 2,206 | 2,651 | 4,343 | 6,285 |
| 2005 | 8,459 | 8,690 | 8,045 | 5,301 | 3,403 | 2,696 | 2,272 | 2,059 | 2,035 | 2,362 | 3,932 | 7,410 |
| 2006 | 8,162 | 7,452 | 8,342 | 4,634 | 3,099 | 2,514 | 2,104 | 1,908 | 1,904 | 2,792 | 3,911 | 5,462 |
| 2007 | 7,549 | 10,385 | 9,097 | 6,027 | 3,278 | 2,858 | 1,890 | 2,260 | 2,225 | 2,549 | 4,592 | 8,793 |
| 2008 | 11,389 | 11,285 | 9,915 | 6,320 | 4,065 | 2,754 | 2,275 | 2,330 | 2,211 | 3,493 | 6,267 | 9,999 |
| 2009 | 12,948 | 12,350 | 9,112 | 6,148 | 3,731 | 2,213 | 2,198 | 2,055 | 2,238 | 3,776 | 5,319 | 9,458 |
| 2010 | 12,429 | 11,571 | 7,820 | 5,121 | 3,510 | 2,359 | 2,035 | 2,815 | 2,279 | 3,603 | 6,571 | 11,940 |
| 2011 | 14,998 | 13,123 | 10,964 | 6,428 | 4,079 | 2,569 | 2,451 | 2,939 | 2,955 | 4,899 | 6,207 | 9,457 |
| 2012 | 11,531 | 11,548 | 7,627 | 5,743 | 3,589 | 2,915 | 2,007 | 2,675 | 3,165 | 3,932 | 7,301 | 11,007 |
| 2013 | 15,685 | 15,724 | 13,093 | 8,208 | 5,051 | 3,422 | 2,537 | 3,109 | 3,585 | 4,995 | 10,392 | 13,980 |
| 2014 | 16,401 | 14,772 | 13,503 | 9,986 | 6,139 | 3,456 | 3,600 | 3,790 | 4,179 | 6,331 | 11,187 | 12,458 |
| 2015 | 18,175 | 18,213 | 14,506 | 7,663 | 4,407 | 4,033 | 3,883 | 3,869 | 3,972 | 7,299 | 9,161 | 9,988 |
| 2016 | 16,338 | 14,235 | 10,864 | 8,886 | 5,675 | 3,735 | 3,804 | 4,040 | 4,249 | 7,159 | 10,251 | 15,614 |
| 2017 | 15,472 | 13,235 | 16,132 | 7,377 | 5,899 | 3,992 | 3,872 | 4,121 | 4,291 | 5,511 | 11,715 | 17,852 |
| 2018 | 18,782 | 17,003 | 15,258 | 10,388 | 4,347 | 4,043 | 3,705 | 4,100 | 4,439 | 6,862 | 14,351 | 15,503 |
| 2019 | 20,316 | 16,787 | 14,714 | 9,082 | 6,268 | 3,951 | 4,133 | 3,907 | 5,015 | 7,099 | 14,040 | 16,205 |
| 2020 | 17,217 | 15,701 | 11,912 | 9,775 | 5,410 | 3,547 | 4,499 | 4,527 | 4,390 | 7,069 | 10,097 | 15,481 |
| 2021 | 16,496 | 16,241 | 12,096 | 7,971 | 4,758 | 3,271 | 4,781 | 3,523 | 4,289 | 5,750 | 10,744 | 13,335 |
| 2022 | 18,512 | 16,622 | 13,192 | 8,715 | 5,649 | 4,273 | 4,024 | 5,001 | 6,268 | 6,906 | 11,202 | 16,360 |
| 2023 | 16,201 | 15,245 | 13,971 | 7,335 | 5,467 | 4,499 | 3,787 | 4,305 | 4,443 | 6,203 | 12,465 | 12,939 |
| 2024 | 17,522 | 15,040 | 12,444 | 9,142 | 4,915 | 4,860 | 3,648 | 3,767 | 4,069 | 6,173 | 8,938 | 14,091 |
| 2025 | 16,810 | 13,837 | 10,661 | 7,375 | 4,639 | 3,534 | 3,016 | 3,279 | 3,468 | 5,765 | 10,273 | 15,114 |
| 2026 | 16,777 | 14,583 | 11,204 | 7,301 | ||||||||
| - = No Data Reported; -- = Not Applicable; NA = Not Available; W = Withheld to avoid disclosure of individual company data. |
| Release Date: 6/30/2026 |
| Next Release Date: 7/31/2026 |