|
Download Data (XLS File) |
|
||||||||
|
||||||||
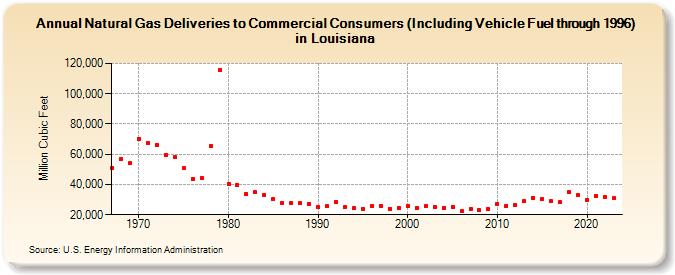
| Natural Gas Deliveries to Commercial Consumers (Including Vehicle Fuel through 1996) in Louisiana (Million Cubic Feet) | ||||||||
| Decade | Year-0 | Year-1 | Year-2 | Year-3 | Year-4 | Year-5 | Year-6 | Year-7 | Year-8 | Year-9 |
|---|---|---|---|---|---|---|---|---|---|---|
| 1960's | 51,062 | 56,937 | 54,010 | |||||||
| 1970's | 70,321 | 67,515 | 66,331 | 59,518 | 58,097 | 50,662 | 43,567 | 44,563 | 65,300 | 115,743 |
| 1980's | 39,996 | 39,507 | 33,729 | 34,906 | 33,088 | 30,228 | 27,985 | 27,845 | 27,475 | 27,156 |
| 1990's | 24,937 | 25,452 | 28,445 | 25,157 | 24,184 | 23,833 | 25,746 | 25,613 | 24,042 | 24,559 |
| 2000's | 25,687 | 24,604 | 25,540 | 25,161 | 24,700 | 25,085 | 22,240 | 23,863 | 22,869 | 23,672 |
| 2010's | 27,009 | 25,925 | 26,294 | 28,875 | 31,277 | 30,270 | 28,931 | 28,322 | 34,848 | 32,925 |
| 2020's | 29,757 | 32,547 | 31,747 | 30,120 | 29,246 | 27,742 |
| - = No Data Reported; -- = Not Applicable; NA = Not Available; W = Withheld to avoid disclosure of individual company data. |
| Release Date: 6/30/2026 |
| Next Release Date: 7/31/2026 |