|
Download Data (XLS File) |
|
||||||||
|
||||||||
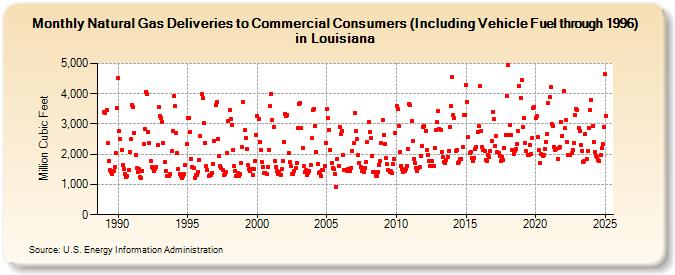
| Natural Gas Deliveries to Commercial Consumers (Including Vehicle Fuel through 1996) in Louisiana (Million Cubic Feet) | ||||||||
| Year | Jan | Feb | Mar | Apr | May | Jun | Jul | Aug | Sep | Oct | Nov | Dec |
|---|---|---|---|---|---|---|---|---|---|---|---|---|
| 1989 | 3,399 | 3,365 | 3,462 | 2,362 | 1,790 | 1,479 | 1,399 | 1,340 | 1,433 | 1,568 | 2,035 | 3,524 |
| 1990 | 4,528 | 2,757 | 2,490 | 2,135 | 1,628 | 1,499 | 1,361 | 1,238 | 1,275 | 1,487 | 2,082 | 2,491 |
| 1991 | 3,639 | 3,555 | 2,713 | 1,974 | 1,539 | 1,418 | 1,504 | 1,253 | 1,229 | 1,440 | 2,347 | 2,842 |
| 1992 | 4,060 | 4,003 | 2,743 | 2,367 | 1,769 | 1,564 | 1,556 | 1,431 | 1,508 | 1,577 | 2,295 | 3,574 |
| 1993 | 3,260 | 3,207 | 3,075 | 2,376 | 1,742 | 1,454 | 1,267 | 1,277 | 1,290 | 1,346 | 2,091 | 2,771 |
| 1994 | 3,925 | 3,581 | 2,691 | 2,033 | 1,500 | 1,360 | 1,272 | 1,223 | 1,283 | 1,360 | 1,633 | 2,322 |
| 1995 | 3,212 | 3,210 | 2,746 | 1,840 | 1,576 | 1,555 | 1,215 | 1,307 | 1,327 | 1,410 | 1,823 | 2,613 |
| 1996 | 4,000 | 3,848 | 3,016 | 2,384 | 1,618 | 1,477 | 1,268 | 1,321 | 1,305 | 1,395 | 1,680 | 2,435 |
| 1997 | 3,629 | 3,711 | 2,519 | 1,931 | 1,615 | 1,529 | 1,473 | 1,306 | 1,353 | 1,413 | 2,047 | 3,087 |
| 1998 | 3,459 | 3,179 | 2,982 | 2,147 | 1,597 | 1,458 | 1,290 | 1,364 | 1,285 | 1,352 | 1,707 | 2,224 |
| 1999 | 3,726 | 2,801 | 2,545 | 2,160 | 1,637 | 1,500 | 1,431 | 1,496 | 1,321 | 1,524 | 1,773 | 2,645 |
| 2000 | 3,256 | 3,177 | 2,415 | 2,131 | 1,731 | 1,561 | 1,365 | 1,387 | 1,348 | 1,562 | 2,154 | 3,600 |
| 2001 | 4,007 | 3,125 | 2,909 | 1,776 | 1,577 | 1,456 | 1,358 | 1,422 | 1,305 | 1,502 | 1,770 | 2,398 |
| 2002 | 3,342 | 3,250 | 3,313 | 2,046 | 1,729 | 1,598 | 1,355 | 1,344 | 1,452 | 1,533 | 1,716 | 2,863 |
| 2003 | 3,658 | 3,694 | 2,864 | 2,190 | 1,609 | 1,398 | 1,469 | 1,306 | 1,376 | 1,438 | 1,628 | 2,530 |
| 2004 | 3,475 | 3,503 | 2,932 | 2,088 | 1,683 | 1,374 | 1,423 | 1,281 | 1,485 | 1,477 | 1,608 | 2,369 |
| 2005 | 3,497 | 3,193 | 2,806 | 2,144 | 1,721 | 1,554 | 1,501 | 1,353 | 932 | 1,856 | 1,626 | 2,901 |
| 2006 | 2,678 | 2,772 | 1,983 | 1,462 | 1,473 | 1,442 | 1,508 | 1,456 | 1,440 | 1,557 | 2,105 | 2,364 |
| 2007 | 3,372 | 2,759 | 2,507 | 1,969 | 1,711 | 1,566 | 1,429 | 1,449 | 1,403 | 1,545 | 1,757 | 2,395 |
| 2008 | 3,059 | 2,742 | 2,526 | 1,941 | 1,421 | 1,421 | 1,279 | 1,284 | 1,406 | 1,649 | 1,768 | 2,375 |
| 2009 | 3,134 | 2,645 | 2,349 | 1,861 | 1,685 | 1,492 | 1,428 | 1,429 | 1,388 | 1,691 | 1,853 | 2,717 |
| 2010 | 3,598 | 3,495 | 2,939 | 2,059 | 1,624 | 1,498 | 1,400 | 1,433 | 1,508 | 1,623 | 2,187 | 3,646 |
| 2011 | 3,615 | 3,099 | 2,441 | 1,855 | 1,701 | 1,541 | 1,455 | 1,538 | 1,570 | 1,925 | 2,284 | 2,901 |
| 2012 | 2,926 | 2,777 | 2,126 | 1,985 | 1,787 | 1,608 | 1,626 | 1,784 | 1,620 | 2,214 | 2,792 | 3,049 |
| 2013 | 3,416 | 2,843 | 2,815 | 2,080 | 1,906 | 1,750 | 1,722 | 1,814 | 1,919 | 2,111 | 2,896 | 3,603 |
| 2014 | 4,539 | 3,295 | 3,201 | 2,113 | 2,145 | 1,709 | 1,731 | 1,849 | 1,848 | 2,232 | 3,308 | 3,307 |
| 2015 | 4,292 | 3,738 | 2,553 | 2,032 | 2,068 | 1,869 | 1,772 | 1,868 | 2,175 | 2,247 | 2,739 | 2,917 |
| 2016 | 4,243 | 2,777 | 2,247 | 2,136 | 2,109 | 1,815 | 1,784 | 1,969 | 1,902 | 2,094 | 2,449 | 3,405 |
| 2017 | 3,169 | 2,287 | 2,588 | 2,057 | 2,025 | 1,926 | 1,791 | 1,907 | 1,796 | 2,200 | 2,647 | 3,928 |
| 2018 | 4,953 | 2,624 | 2,976 | 2,636 | 2,139 | 2,011 | 2,113 | 2,165 | 2,331 | 2,784 | 4,252 | 3,863 |
| 2019 | 4,449 | 2,894 | 3,199 | 2,374 | 2,098 | 1,978 | 1,976 | 2,308 | 2,018 | 2,527 | 3,528 | 3,575 |
| 2020 | 3,203 | 3,253 | 2,573 | 2,154 | 1,716 | 1,993 | 1,955 | 1,958 | 2,183 | 2,414 | 2,664 | 3,691 |
| 2021 | 3,877 | 4,222 | 2,994 | 2,918 | 2,240 | 2,140 | 2,181 | 1,843 | 2,197 | 2,254 | 3,076 | 2,604 |
| 2022 | 4,087 | 2,853 | 3,130 | 2,420 | 1,961 | 1,987 | 1,966 | 2,030 | 2,140 | 2,379 | 3,285 | 3,510 |
| 2023 | 3,566 | 2,961 | 2,903 | 2,398 | 2,183 | 1,819 | 1,825 | 1,858 | 1,892 | 2,186 | 2,958 | 3,571 |
| 2024 | 3,958 | 3,052 | 2,516 | 2,172 | 2,037 | 1,970 | 1,874 | 1,857 | 2,039 | 2,287 | 2,446 | 3,037 |
| 2025 | 4,570 | 3,191 | 2,610 | 2,139 | 2,032 | 1,908 | 1,616 | 1,408 | 1,552 | 1,824 | 1,962 | 2,931 |
| 2026 | NA | NA | 2,275 | NA | ||||||||
| - = No Data Reported; -- = Not Applicable; NA = Not Available; W = Withheld to avoid disclosure of individual company data. |
| Release Date: 6/30/2026 |
| Next Release Date: 7/31/2026 |