|
Download Data (XLS File) |
|
||||||||
|
||||||||
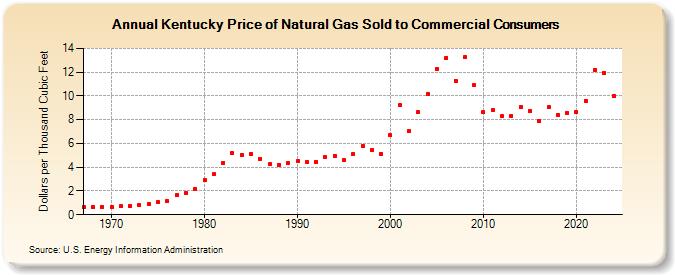
| Kentucky Price of Natural Gas Sold to Commercial Consumers (Dollars per Thousand Cubic Feet) | ||||||||
| Decade | Year-0 | Year-1 | Year-2 | Year-3 | Year-4 | Year-5 | Year-6 | Year-7 | Year-8 | Year-9 |
|---|---|---|---|---|---|---|---|---|---|---|
| 1960's | 0.68 | 0.64 | 0.65 | |||||||
| 1970's | 0.67 | 0.71 | 0.75 | 0.81 | 0.91 | 1.06 | 1.15 | 1.66 | 1.83 | 2.20 |
| 1980's | 2.92 | 3.39 | 4.39 | 5.16 | 5.04 | 5.10 | 4.73 | 4.26 | 4.21 | 4.35 |
| 1990's | 4.52 | 4.44 | 4.47 | 4.82 | 4.98 | 4.60 | 5.09 | 5.79 | 5.43 | 5.14 |
| 2000's | 6.68 | 9.20 | 7.05 | 8.62 | 10.18 | 12.27 | 13.22 | 11.29 | 13.25 | 10.89 |
| 2010's | 8.61 | 8.79 | 8.28 | 8.32 | 9.06 | 8.75 | 7.89 | 9.06 | 8.43 | 8.60 |
| 2020's | 8.64 | 9.59 | 12.17 | 11.89 | 10.12 | 11.06 |
| - = No Data Reported; -- = Not Applicable; NA = Not Available; W = Withheld to avoid disclosure of individual company data. |
| Release Date: 5/29/2026 |
| Next Release Date: 6/30/2026 |