|
Download Data (XLS File) |
|
||||||||
|
||||||||
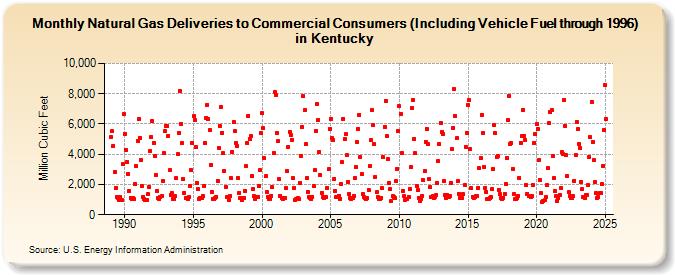
| Natural Gas Deliveries to Commercial Consumers (Including Vehicle Fuel through 1996) in Kentucky (Million Cubic Feet) | ||||||||
| Year | Jan | Feb | Mar | Apr | May | Jun | Jul | Aug | Sep | Oct | Nov | Dec |
|---|---|---|---|---|---|---|---|---|---|---|---|---|
| 1989 | 5,139 | 5,507 | 4,546 | 2,840 | 1,766 | 1,167 | 1,099 | 991 | 1,147 | 954 | 3,327 | 6,648 |
| 1990 | 5,355 | 4,280 | 3,496 | 2,702 | 1,576 | 1,129 | 1,037 | 1,077 | 1,025 | 2,050 | 3,194 | 4,884 |
| 1991 | 6,313 | 5,098 | 3,647 | 1,925 | 1,198 | 1,029 | 941 | 991 | 1,338 | 1,862 | 4,197 | 5,161 |
| 1992 | 6,191 | 4,758 | 3,874 | 2,612 | 1,600 | 1,132 | 1,066 | 1,158 | 1,209 | 2,237 | 4,064 | 5,519 |
| 1993 | 5,878 | 5,863 | 5,207 | 2,934 | 1,330 | 1,449 | 1,029 | 1,060 | 1,220 | 2,417 | 3,997 | 5,433 |
| 1994 | 8,181 | 6,018 | 4,741 | 2,348 | 1,445 | 1,104 | 1,115 | 1,017 | 1,181 | 1,926 | 2,945 | 4,722 |
| 1995 | 6,500 | 6,248 | 4,486 | 2,090 | 1,687 | 1,060 | 1,130 | 1,099 | 1,247 | 1,892 | 4,746 | 6,426 |
| 1996 | 7,275 | 6,319 | 5,586 | 3,305 | 1,509 | 1,057 | 1,033 | 1,123 | 1,194 | 2,241 | 4,439 | 5,892 |
| 1997 | 7,139 | 5,428 | 4,048 | 2,878 | 1,863 | 1,166 | 1,157 | 948 | 1,249 | 2,417 | 4,175 | 6,158 |
| 1998 | 5,531 | 4,755 | 4,522 | 2,423 | 1,466 | 1,096 | 996 | 1,073 | 1,089 | 1,601 | 3,198 | 4,714 |
| 1999 | 6,549 | 5,011 | 5,181 | 2,574 | 1,694 | 1,216 | 1,012 | 1,167 | 1,190 | 1,872 | 2,938 | 5,395 |
| 2000 | 6,707 | 5,715 | 3,728 | 2,534 | 1,492 | 1,147 | 1,056 | 1,060 | 1,247 | 1,804 | 4,089 | 8,089 |
| 2001 | 7,901 | 5,421 | 4,854 | 2,339 | 1,262 | 1,081 | 1,015 | 1,119 | 1,138 | 1,772 | 2,867 | 4,485 |
| 2002 | 5,497 | 5,249 | 4,970 | 2,399 | 1,792 | 989 | 1,071 | 1,100 | 1,033 | 2,122 | 3,894 | 5,827 |
| 2003 | 7,826 | 6,918 | 4,647 | 2,415 | 1,512 | 1,177 | 1,073 | 1,071 | 1,195 | 1,898 | 2,926 | 5,553 |
| 2004 | 7,333 | 6,286 | 4,160 | 2,641 | 1,462 | 1,151 | 1,135 | 1,143 | 1,187 | 1,791 | 3,019 | 5,681 |
| 2005 | 6,354 | 5,086 | 4,947 | 2,392 | 1,557 | 1,172 | 1,181 | 1,266 | 1,066 | 2,060 | 3,456 | 6,357 |
| 2006 | 4,992 | 5,320 | 3,917 | 2,159 | 1,394 | 1,092 | 1,055 | 1,078 | 1,239 | 2,415 | 3,142 | 4,787 |
| 2007 | 5,693 | 6,607 | 3,830 | 2,677 | 1,389 | 1,153 | 1,094 | 1,050 | 1,083 | 1,640 | 3,231 | 4,938 |
| 2008 | 6,892 | 5,900 | 4,644 | 2,509 | 1,497 | 1,172 | 1,041 | 1,039 | 1,121 | 1,749 | 3,789 | 5,817 |
| 2009 | 7,524 | 5,197 | 3,659 | 2,129 | 1,679 | 928 | 1,236 | 1,184 | 1,114 | 2,224 | 3,052 | 5,512 |
| 2010 | 7,158 | 6,672 | 4,050 | 1,595 | 1,207 | 1,002 | 1,008 | 1,064 | 1,203 | 1,690 | 3,127 | 7,042 |
| 2011 | 7,608 | 5,039 | 4,056 | 1,902 | 1,639 | 1,132 | 922 | 1,061 | 1,258 | 2,269 | 2,865 | 4,839 |
| 2012 | 5,672 | 4,643 | 2,366 | 1,819 | 1,190 | 1,236 | 1,076 | 1,160 | 1,284 | 2,105 | 3,550 | 4,671 |
| 2013 | 6,071 | 5,493 | 5,334 | 2,221 | 1,298 | 1,136 | 1,298 | 1,154 | 1,242 | 2,101 | 4,325 | 5,748 |
| 2014 | 8,298 | 6,516 | 5,051 | 2,219 | 1,390 | 1,079 | 1,077 | 1,120 | 1,340 | 1,965 | 4,502 | 5,410 |
| 2015 | 7,275 | 7,562 | 4,345 | 1,739 | 1,202 | 1,125 | 1,192 | 1,205 | 1,208 | 1,788 | 3,061 | 3,735 |
| 2016 | 6,623 | 5,408 | 3,178 | 1,798 | 1,523 | 1,012 | 1,066 | 1,127 | 1,176 | 1,698 | 2,991 | 5,920 |
| 2017 | 5,380 | 3,815 | 3,882 | 1,660 | 1,338 | 1,101 | 1,042 | 1,137 | 1,379 | 2,045 | 3,761 | 6,256 |
| 2018 | 7,862 | 4,686 | 4,713 | 3,043 | 1,366 | 1,027 | 1,034 | 1,102 | 1,232 | 2,453 | 4,775 | 5,177 |
| 2019 | 6,937 | 5,227 | 4,947 | 1,959 | 1,393 | 1,251 | 1,236 | 1,187 | 1,219 | 1,961 | 4,763 | 5,314 |
| 2020 | 5,996 | 5,690 | 3,634 | 2,282 | 1,415 | 851 | 896 | 944 | 1,178 | 1,946 | 3,086 | 6,033 |
| 2021 | 6,771 | 6,899 | 3,879 | 2,418 | 1,565 | 1,250 | 916 | 1,083 | 1,308 | 1,751 | 4,134 | 4,010 |
| 2022 | 7,597 | 5,874 | 3,923 | 2,555 | 1,496 | 1,260 | 1,120 | 1,131 | 1,209 | 2,242 | 3,930 | 6,155 |
| 2023 | 5,649 | 4,669 | 4,405 | 2,133 | 1,679 | 1,190 | 1,116 | 1,282 | 1,301 | 1,936 | 3,764 | 5,232 |
| 2024 | 7,486 | 4,800 | 3,622 | 2,135 | 1,409 | 1,078 | 1,156 | 1,399 | 1,456 | 2,016 | 3,212 | 5,565 |
| 2025 | 8,542 | 6,255 | 3,864 | 2,005 | 1,696 | 1,181 | 1,119 | 1,242 | 1,317 | 2,002 | 4,128 | 6,641 |
| 2026 | 8,447 | 5,468 | 3,558 | 1,608 | ||||||||
| - = No Data Reported; -- = Not Applicable; NA = Not Available; W = Withheld to avoid disclosure of individual company data. |
| Release Date: 6/30/2026 |
| Next Release Date: 7/31/2026 |