|
Download Data (XLS File) |
|
||||||||
|
||||||||
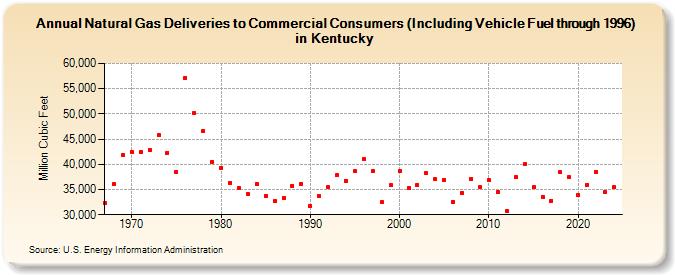
| Natural Gas Deliveries to Commercial Consumers (Including Vehicle Fuel through 1996) in Kentucky (Million Cubic Feet) | ||||||||
| Decade | Year-0 | Year-1 | Year-2 | Year-3 | Year-4 | Year-5 | Year-6 | Year-7 | Year-8 | Year-9 |
|---|---|---|---|---|---|---|---|---|---|---|
| 1960's | 32,313 | 36,089 | 41,934 | |||||||
| 1970's | 42,461 | 42,352 | 42,843 | 45,797 | 42,320 | 38,497 | 57,203 | 50,170 | 46,647 | 40,509 |
| 1980's | 39,359 | 36,379 | 35,260 | 34,111 | 36,138 | 33,758 | 32,666 | 33,298 | 35,718 | 36,148 |
| 1990's | 31,806 | 33,700 | 35,419 | 37,817 | 36,744 | 38,610 | 40,972 | 38,627 | 32,464 | 35,798 |
| 2000's | 38,669 | 35,255 | 35,942 | 38,212 | 36,989 | 36,894 | 32,590 | 34,386 | 37,167 | 35,438 |
| 2010's | 36,818 | 34,592 | 30,771 | 37,422 | 39,967 | 35,435 | 33,520 | 32,796 | 38,472 | 37,395 |
| 2020's | 33,950 | 35,984 | 38,492 | 34,356 | 35,332 | 39,993 |
| - = No Data Reported; -- = Not Applicable; NA = Not Available; W = Withheld to avoid disclosure of individual company data. |
| Release Date: 6/30/2026 |
| Next Release Date: 7/31/2026 |