|
Download Data (XLS File) |
|
||||||||
|
||||||||
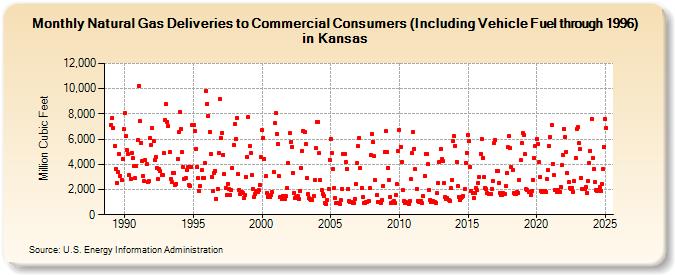
| Natural Gas Deliveries to Commercial Consumers (Including Vehicle Fuel through 1996) in Kansas (Million Cubic Feet) | ||||||||
| Year | Jan | Feb | Mar | Apr | May | Jun | Jul | Aug | Sep | Oct | Nov | Dec |
|---|---|---|---|---|---|---|---|---|---|---|---|---|
| 1989 | 7,155 | 7,697 | 6,870 | 5,433 | 3,660 | 2,547 | 3,366 | 4,812 | 3,081 | 2,785 | 4,386 | 6,763 |
| 1990 | 8,061 | 6,230 | 5,114 | 4,800 | 3,112 | 2,848 | 4,906 | 4,462 | 3,836 | 2,893 | 3,877 | 5,907 |
| 1991 | 10,250 | 7,397 | 5,694 | 4,278 | 3,082 | 2,657 | 4,321 | 3,994 | 2,629 | 2,656 | 6,075 | 5,538 |
| 1992 | 6,844 | 5,862 | 4,372 | 4,571 | 3,736 | 2,814 | 3,609 | 3,462 | 3,132 | 3,162 | 4,867 | 7,543 |
| 1993 | 8,768 | 7,385 | 7,019 | 4,938 | 2,840 | 2,559 | 3,348 | 3,324 | 2,395 | 2,469 | 4,413 | 6,565 |
| 1994 | 8,139 | 6,811 | 4,960 | 3,774 | 2,816 | 2,890 | 3,526 | 3,749 | 2,352 | 2,315 | 3,819 | 7,103 |
| 1995 | 7,157 | 6,607 | 5,250 | 3,756 | 2,912 | 1,843 | 2,294 | 3,564 | 2,921 | 2,903 | 4,066 | 9,850 |
| 1996 | 8,819 | 7,823 | 6,592 | 4,820 | 3,017 | 1,916 | 3,341 | 3,505 | 1,286 | 2,057 | 4,867 | 9,187 |
| 1997 | 6,069 | 6,502 | 4,739 | 3,206 | 2,127 | 1,560 | 2,474 | 2,018 | 1,580 | 1,946 | 3,698 | 5,563 |
| 1998 | 7,182 | 6,044 | 7,699 | 3,225 | 1,973 | 1,619 | 1,811 | 1,713 | 1,323 | 1,588 | 3,019 | 4,591 |
| 1999 | 7,763 | 5,446 | 4,864 | 3,144 | 2,061 | 1,427 | 1,628 | 1,905 | 1,820 | 1,947 | 2,395 | 4,553 |
| 2000 | 6,732 | 6,091 | 4,404 | 3,039 | 1,751 | 1,434 | 1,473 | 1,401 | 1,545 | 1,768 | 3,421 | 7,239 |
| 2001 | 8,040 | 6,415 | 5,614 | 3,040 | 1,440 | 1,230 | 1,465 | 1,352 | 1,273 | 1,461 | 2,155 | 4,076 |
| 2002 | 6,451 | 5,744 | 5,410 | 3,342 | 1,743 | 1,320 | 1,413 | 1,452 | 1,274 | 1,902 | 3,693 | 5,058 |
| 2003 | 6,667 | 6,592 | 5,599 | 2,903 | 1,636 | 1,308 | 1,232 | 1,196 | 1,164 | 1,488 | 2,742 | 5,255 |
| 2004 | 7,357 | 7,364 | 4,864 | 2,731 | 1,958 | 1,660 | 1,503 | 919 | 846 | 1,200 | 2,012 | 4,365 |
| 2005 | 6,022 | 4,892 | 3,613 | 2,137 | 1,335 | 946 | 907 | 908 | 821 | 1,128 | 2,064 | 4,841 |
| 2006 | 4,846 | 4,220 | 3,643 | 2,023 | 1,095 | 972 | 1,038 | 953 | 910 | 1,266 | 2,420 | 4,120 |
| 2007 | 5,424 | 6,090 | 3,689 | 2,137 | 1,413 | 900 | 950 | 977 | 992 | 1,125 | 2,093 | 4,757 |
| 2008 | 6,392 | 5,759 | 4,639 | 2,731 | 1,539 | 1,015 | 1,029 | 1,000 | 933 | 1,195 | 2,307 | 4,992 |
| 2009 | 6,627 | 4,982 | 3,727 | 2,778 | 1,400 | 965 | 1,003 | 1,060 | 952 | 1,573 | 2,424 | 5,020 |
| 2010 | 6,723 | 5,394 | 4,152 | 1,964 | 1,091 | 953 | 978 | 956 | 813 | 1,072 | 2,829 | 4,873 |
| 2011 | 6,560 | 5,252 | 3,607 | 2,074 | 1,122 | 1,010 | 1,105 | 1,113 | 901 | 1,478 | 3,073 | 4,822 |
| 2012 | 4,809 | 4,003 | 1,965 | 1,205 | 983 | 1,106 | 1,021 | 1,008 | 951 | 1,693 | 2,497 | 4,211 |
| 2013 | 5,209 | 4,387 | 4,229 | 2,480 | 1,436 | 1,261 | 1,290 | 1,169 | 1,084 | 2,119 | 2,720 | 5,817 |
| 2014 | 6,217 | 5,471 | 4,217 | 2,276 | 1,432 | 1,177 | 1,364 | 1,395 | 1,494 | 2,052 | 4,127 | 4,932 |
| 2015 | 6,338 | 5,825 | 3,805 | 1,900 | 1,722 | 1,288 | 1,709 | 2,149 | 1,927 | 2,551 | 2,976 | 4,856 |
| 2016 | 6,023 | 4,496 | 2,969 | 2,124 | 2,045 | 1,723 | 1,607 | 1,674 | 1,640 | 2,056 | 2,687 | 5,714 |
| 2017 | 5,918 | 3,492 | 3,467 | 2,532 | 1,748 | 1,546 | 1,552 | 1,716 | 1,655 | 2,298 | 3,338 | 5,348 |
| 2018 | 6,242 | 5,280 | 3,787 | 3,523 | 1,734 | 1,671 | 1,636 | 1,833 | 1,756 | 2,761 | 4,304 | 5,721 |
| 2019 | 6,460 | 6,332 | 4,785 | 2,014 | 1,962 | 1,817 | 1,776 | 1,575 | 1,907 | 2,776 | 4,495 | 5,421 |
| 2020 | 5,997 | 5,584 | 4,176 | 2,987 | 1,919 | 1,776 | 1,848 | 1,906 | 1,826 | 2,846 | 3,527 | 5,466 |
| 2021 | 6,150 | 7,143 | 4,063 | 3,121 | 1,990 | 1,992 | 1,842 | 1,974 | 1,823 | 2,209 | 3,926 | 4,777 |
| 2022 | 6,822 | 6,161 | 5,007 | 3,296 | 2,572 | 2,104 | 2,075 | 2,129 | 1,813 | 2,652 | 4,531 | 6,812 |
| 2023 | 6,913 | 5,645 | 5,191 | 2,945 | 2,032 | 2,024 | 2,041 | 2,206 | 1,769 | 2,710 | 4,122 | 5,073 |
| 2024 | 7,599 | 4,513 | 3,630 | 2,550 | 1,955 | 1,906 | 1,948 | 2,158 | 1,839 | 2,452 | 3,794 | 5,354 |
| 2025 | 7,711 | 6,979 | 3,903 | 2,627 | 2,222 | 2,001 | 2,202 | 2,124 | 1,907 | 2,273 | 3,769 | 5,913 |
| 2026 | 7,141 | 4,738 | 3,886 | 2,547 | ||||||||
| - = No Data Reported; -- = Not Applicable; NA = Not Available; W = Withheld to avoid disclosure of individual company data. |
| Release Date: 6/30/2026 |
| Next Release Date: 7/31/2026 |