|
Download Data (XLS File) |
|
||||||||
|
||||||||
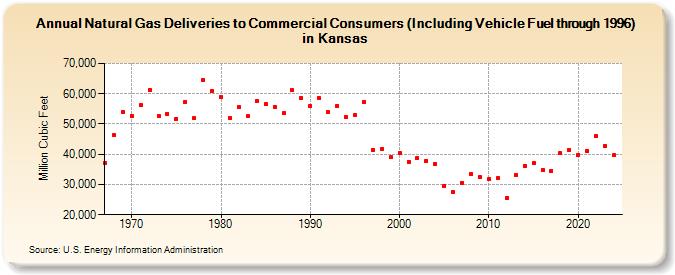
| Natural Gas Deliveries to Commercial Consumers (Including Vehicle Fuel through 1996) in Kansas (Million Cubic Feet) | ||||||||
| Decade | Year-0 | Year-1 | Year-2 | Year-3 | Year-4 | Year-5 | Year-6 | Year-7 | Year-8 | Year-9 |
|---|---|---|---|---|---|---|---|---|---|---|
| 1960's | 37,141 | 46,232 | 54,062 | |||||||
| 1970's | 52,632 | 56,246 | 61,286 | 52,674 | 53,461 | 51,705 | 57,310 | 51,815 | 64,532 | 60,931 |
| 1980's | 58,880 | 52,036 | 55,470 | 52,535 | 57,516 | 56,522 | 55,730 | 53,609 | 61,120 | 58,554 |
| 1990's | 56,045 | 58,571 | 53,973 | 56,023 | 52,253 | 53,122 | 57,229 | 41,482 | 41,788 | 38,952 |
| 2000's | 40,297 | 37,560 | 38,802 | 37,781 | 36,779 | 29,616 | 27,505 | 30,546 | 33,531 | 32,512 |
| 2010's | 31,799 | 32,117 | 25,452 | 33,198 | 36,154 | 37,047 | 34,757 | 34,612 | 40,249 | 41,320 |
| 2020's | 39,857 | 41,010 | 45,973 | 42,672 | 39,698 | 43,632 |
| - = No Data Reported; -- = Not Applicable; NA = Not Available; W = Withheld to avoid disclosure of individual company data. |
| Release Date: 6/30/2026 |
| Next Release Date: 7/31/2026 |