|
Download Data (XLS File) |
|
||||||||
|
||||||||
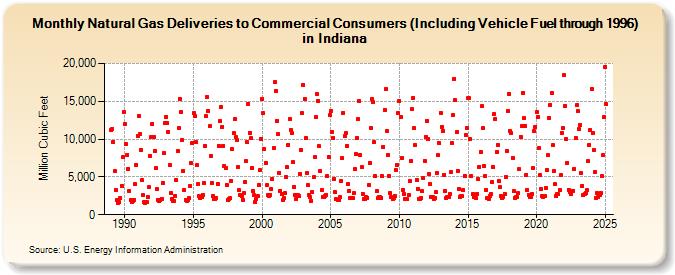
| Natural Gas Deliveries to Commercial Consumers (Including Vehicle Fuel through 1996) in Indiana (Million Cubic Feet) | ||||||||
| Year | Jan | Feb | Mar | Apr | May | Jun | Jul | Aug | Sep | Oct | Nov | Dec |
|---|---|---|---|---|---|---|---|---|---|---|---|---|
| 1989 | 11,170 | 11,376 | 9,613 | 5,768 | 3,297 | 1,904 | 1,579 | 1,659 | 2,217 | 3,850 | 7,577 | 13,614 |
| 1990 | 11,991 | 9,374 | 7,958 | 6,087 | 3,191 | 1,963 | 1,658 | 1,860 | 1,991 | 4,087 | 6,640 | 10,462 |
| 1991 | 13,081 | 10,656 | 8,567 | 4,535 | 2,546 | 1,648 | 1,613 | 1,710 | 2,358 | 3,614 | 7,821 | 10,233 |
| 1992 | 12,060 | 10,265 | 8,437 | 6,172 | 3,400 | 2,004 | 1,811 | 1,955 | 2,131 | 4,253 | 8,135 | 12,097 |
| 1993 | 12,941 | 12,125 | 10,972 | 6,557 | 2,866 | 2,100 | 1,819 | 1,838 | 2,442 | 4,559 | 8,381 | 11,447 |
| 1994 | 15,350 | 13,616 | 9,874 | 5,778 | 3,242 | 1,967 | 1,790 | 1,932 | 2,185 | 3,821 | 6,781 | 9,484 |
| 1995 | 13,484 | 13,113 | 9,559 | 6,546 | 4,048 | 2,442 | 2,230 | 2,328 | 2,645 | 4,181 | 9,142 | 13,009 |
| 1996 | 15,590 | 13,698 | 11,697 | 7,791 | 4,195 | 2,464 | 2,111 | 2,104 | 2,202 | 4,102 | 9,122 | 12,378 |
| 1997 | 14,296 | 11,608 | 9,129 | 6,466 | 6,196 | 3,988 | 1,941 | 2,069 | 2,173 | 4,515 | 8,632 | 10,742 |
| 1998 | 12,613 | 10,260 | 9,874 | 6,292 | 3,206 | 2,650 | 2,413 | 1,984 | 2,897 | 4,311 | 7,058 | 9,557 |
| 1999 | 14,686 | 10,869 | 10,099 | 6,200 | 3,104 | 2,590 | 1,625 | 2,122 | 2,477 | 3,955 | 5,880 | 10,036 |
| 2000 | 15,368 | 13,386 | 8,703 | 6,850 | 3,896 | 2,641 | 2,502 | 2,597 | 3,340 | 4,729 | 8,877 | 17,488 |
| 2001 | 16,387 | 12,430 | 10,649 | 5,558 | 3,200 | 2,710 | 1,957 | 2,211 | 2,832 | 5,016 | 6,253 | 9,276 |
| 2002 | 12,638 | 11,220 | 10,759 | 6,909 | 3,723 | 2,669 | 2,107 | 2,555 | 2,484 | 5,357 | 8,600 | 13,405 |
| 2003 | 17,166 | 15,337 | 10,136 | 5,494 | 3,916 | 2,579 | 2,330 | 1,867 | 3,003 | 4,932 | 7,578 | 12,887 |
| 2004 | 15,930 | 15,104 | 9,038 | 5,772 | 3,240 | 2,372 | 2,385 | 2,533 | 2,653 | 5,092 | 7,628 | 13,134 |
| 2005 | 13,729 | 10,934 | 10,165 | 4,732 | 2,959 | 2,040 | 1,966 | 1,910 | 2,373 | 4,413 | 7,488 | 13,509 |
| 2006 | 10,389 | 10,833 | 9,140 | 4,051 | 3,166 | 2,182 | 2,236 | 2,192 | 2,827 | 5,983 | 7,969 | 10,113 |
| 2007 | 12,657 | 14,982 | 7,846 | 6,250 | 2,800 | 2,114 | 2,020 | 2,329 | 2,274 | 3,935 | 6,856 | 11,499 |
| 2008 | 15,283 | 14,876 | 9,611 | 5,057 | 3,085 | 2,169 | 2,286 | 2,321 | 2,252 | 5,096 | 8,963 | 13,859 |
| 2009 | 16,629 | 11,071 | 7,933 | 5,181 | 2,834 | 2,374 | 2,099 | 2,238 | 2,463 | 5,920 | 6,612 | 13,409 |
| 2010 | 15,009 | 12,920 | 7,546 | 3,296 | 2,800 | 2,109 | 2,043 | 2,032 | 2,639 | 4,475 | 7,084 | 13,930 |
| 2011 | 15,473 | 11,447 | 9,188 | 4,598 | 3,459 | 2,106 | 2,114 | 2,231 | 3,083 | 4,819 | 7,137 | 10,338 |
| 2012 | 12,440 | 10,028 | 5,340 | 4,058 | 2,398 | 2,290 | 2,042 | 2,252 | 2,958 | 5,528 | 7,862 | 9,468 |
| 2013 | 13,475 | 11,623 | 11,129 | 5,318 | 3,159 | 2,206 | 2,288 | 2,391 | 2,739 | 5,615 | 9,456 | 13,199 |
| 2014 | 17,995 | 15,117 | 10,893 | 5,827 | 3,368 | 2,360 | 2,514 | 2,449 | 3,216 | 5,183 | 10,520 | 11,472 |
| 2015 | 15,390 | 15,393 | 9,954 | 5,094 | 2,726 | 2,309 | 2,357 | 2,171 | 2,766 | 4,689 | 6,376 | 8,326 |
| 2016 | 14,341 | 11,412 | 6,491 | 5,162 | 3,276 | 2,175 | 2,087 | 2,477 | 2,719 | 4,328 | 6,368 | 13,295 |
| 2017 | 12,717 | 8,353 | 9,268 | 4,419 | 3,621 | 2,437 | 2,231 | 2,390 | 2,765 | 4,996 | 8,404 | 13,712 |
| 2018 | 15,957 | 11,042 | 10,828 | 7,551 | 3,094 | 2,221 | 2,299 | 2,317 | 2,828 | 6,007 | 10,311 | 11,733 |
| 2019 | 16,162 | 12,754 | 11,740 | 5,289 | 3,271 | 2,634 | 2,363 | 2,358 | 2,761 | 6,239 | 11,066 | 11,610 |
| 2020 | 13,574 | 12,940 | 8,826 | 5,193 | 3,424 | 2,409 | 2,398 | 2,498 | 3,556 | 5,942 | 7,859 | 12,793 |
| 2021 | 14,563 | 16,134 | 9,161 | 5,810 | 4,023 | 2,468 | 2,697 | 2,691 | 3,209 | 5,207 | 10,868 | 11,456 |
| 2022 | 18,427 | 14,436 | 9,987 | 6,889 | 3,323 | 2,953 | 2,749 | 3,138 | 3,175 | 6,062 | 10,173 | 14,504 |
| 2023 | 13,645 | 11,273 | 11,843 | 5,500 | 3,854 | 2,607 | 2,740 | 2,929 | 3,168 | 7,067 | 9,254 | 11,211 |
| 2024 | 17,352 | 11,255 | 8,962 | 5,861 | 2,310 | 2,967 | 2,448 | 2,738 | 3,053 | 5,303 | 8,172 | 13,408 |
| 2025 | 19,913 | 14,823 | 9,226 | 6,281 | 3,785 | 2,578 | 2,730 | 2,956 | 3,202 | 6,132 | 9,887 | 15,985 |
| 2026 | 18,823 | 13,170 | 8,876 | 5,066 | ||||||||
| - = No Data Reported; -- = Not Applicable; NA = Not Available; W = Withheld to avoid disclosure of individual company data. |
| Release Date: 6/30/2026 |
| Next Release Date: 7/31/2026 |