|
Download Data (XLS File) |
|
||||||||
|
||||||||
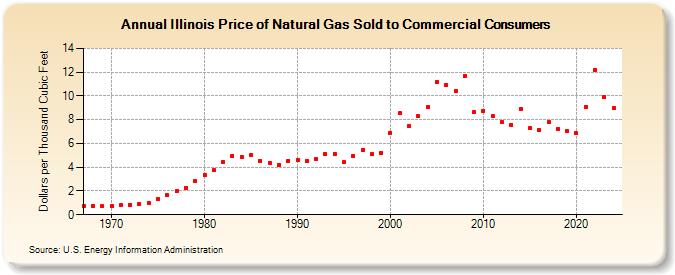
| Illinois Price of Natural Gas Sold to Commercial Consumers (Dollars per Thousand Cubic Feet) | ||||||||
| Decade | Year-0 | Year-1 | Year-2 | Year-3 | Year-4 | Year-5 | Year-6 | Year-7 | Year-8 | Year-9 |
|---|---|---|---|---|---|---|---|---|---|---|
| 1960's | 0.75 | 0.73 | 0.71 | |||||||
| 1970's | 0.75 | 0.78 | 0.84 | 0.89 | 1.02 | 1.31 | 1.64 | 1.99 | 2.27 | 2.81 |
| 1980's | 3.34 | 3.74 | 4.44 | 4.97 | 4.86 | 5.03 | 4.56 | 4.39 | 4.19 | 4.55 |
| 1990's | 4.64 | 4.56 | 4.65 | 5.10 | 5.12 | 4.42 | 4.92 | 5.43 | 5.07 | 5.20 |
| 2000's | 6.90 | 8.55 | 7.47 | 8.27 | 9.10 | 11.20 | 10.91 | 10.40 | 11.70 | 8.66 |
| 2010's | 8.76 | 8.27 | 7.78 | 7.57 | 8.86 | 7.29 | 7.14 | 7.78 | 7.24 | 7.02 |
| 2020's | 6.84 | 9.10 | 12.20 | 9.91 | 9.30 | 9.63 |
| - = No Data Reported; -- = Not Applicable; NA = Not Available; W = Withheld to avoid disclosure of individual company data. |
| Release Date: 5/29/2026 |
| Next Release Date: 6/30/2026 |