|
Download Data (XLS File) |
|
||||||||
|
||||||||
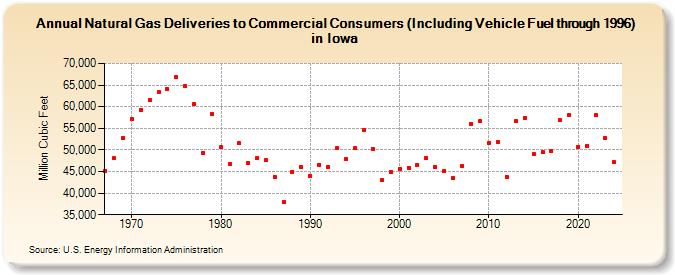
| Natural Gas Deliveries to Commercial Consumers (Including Vehicle Fuel through 1996) in Iowa (Million Cubic Feet) | ||||||||
| Decade | Year-0 | Year-1 | Year-2 | Year-3 | Year-4 | Year-5 | Year-6 | Year-7 | Year-8 | Year-9 |
|---|---|---|---|---|---|---|---|---|---|---|
| 1960's | 45,118 | 48,034 | 52,700 | |||||||
| 1970's | 57,266 | 59,138 | 61,623 | 63,350 | 64,052 | 66,915 | 64,734 | 60,519 | 49,200 | 58,308 |
| 1980's | 50,588 | 46,804 | 51,536 | 46,854 | 48,104 | 47,643 | 43,709 | 38,057 | 44,955 | 46,142 |
| 1990's | 43,953 | 46,615 | 46,095 | 50,337 | 47,922 | 50,325 | 54,571 | 50,191 | 43,027 | 44,895 |
| 2000's | 45,609 | 45,892 | 46,423 | 48,081 | 46,068 | 45,152 | 43,424 | 46,367 | 56,099 | 56,698 |
| 2010's | 51,674 | 51,875 | 43,767 | 56,592 | 57,439 | 49,165 | 49,414 | 49,710 | 56,854 | 57,985 |
| 2020's | 50,766 | 50,918 | 58,074 | 52,756 | 49,038 | 53,351 |
| - = No Data Reported; -- = Not Applicable; NA = Not Available; W = Withheld to avoid disclosure of individual company data. |
| Release Date: 6/30/2026 |
| Next Release Date: 7/31/2026 |