|
Download Data (XLS File) |
|
||||||||
|
||||||||
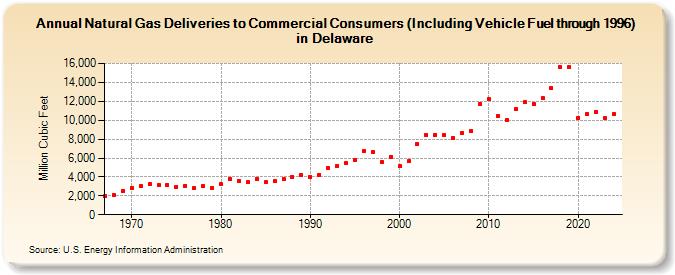
| Natural Gas Deliveries to Commercial Consumers (Including Vehicle Fuel through 1996) in Delaware (Million Cubic Feet) | ||||||||
| Decade | Year-0 | Year-1 | Year-2 | Year-3 | Year-4 | Year-5 | Year-6 | Year-7 | Year-8 | Year-9 |
|---|---|---|---|---|---|---|---|---|---|---|
| 1960's | 1,968 | 2,084 | 2,526 | |||||||
| 1970's | 2,804 | 3,010 | 3,205 | 3,093 | 3,169 | 2,964 | 3,078 | 2,815 | 3,005 | 2,842 |
| 1980's | 3,246 | 3,783 | 3,577 | 3,428 | 3,827 | 3,412 | 3,514 | 3,741 | 4,041 | 4,184 |
| 1990's | 4,042 | 4,253 | 4,965 | 5,195 | 5,459 | 5,743 | 6,694 | 6,608 | 5,590 | 6,119 |
| 2000's | 5,125 | 5,680 | 7,477 | 8,437 | 8,465 | 8,383 | 8,134 | 8,628 | 8,868 | 11,684 |
| 2010's | 12,193 | 10,478 | 10,034 | 11,170 | 11,882 | 11,731 | 12,340 | 13,380 | 15,593 | 15,590 |
| 2020's | 10,249 | 10,621 | 10,902 | 10,183 | 10,379 | 11,670 |
| - = No Data Reported; -- = Not Applicable; NA = Not Available; W = Withheld to avoid disclosure of individual company data. |
| Release Date: 6/30/2026 |
| Next Release Date: 7/31/2026 |