|
Download Data (XLS File) |
|
||||||||
|
||||||||
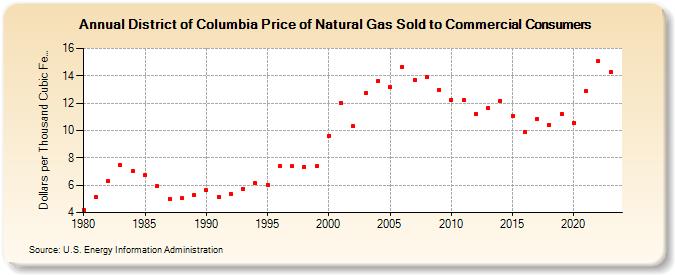
| District of Columbia Price of Natural Gas Sold to Commercial Consumers (Dollars per Thousand Cubic Feet) | ||||||||
| Decade | Year-0 | Year-1 | Year-2 | Year-3 | Year-4 | Year-5 | Year-6 | Year-7 | Year-8 | Year-9 |
|---|---|---|---|---|---|---|---|---|---|---|
| 1980's | 4.22 | 5.12 | 6.28 | 7.44 | 7.04 | 6.72 | 5.91 | 5.01 | 5.03 | 5.30 |
| 1990's | 5.63 | 5.17 | 5.36 | 5.75 | 6.16 | 6.04 | 7.37 | 7.37 | 7.36 | 7.38 |
| 2000's | 9.63 | 12.02 | 10.30 | 12.73 | 13.60 | 13.17 | 14.67 | 13.69 | 13.90 | 12.99 |
| 2010's | 12.26 | 12.24 | 11.19 | 11.64 | 12.18 | 11.07 | 9.88 | 10.87 | 10.42 | 11.23 |
| 2020's | 10.58 | 12.89 | 15.05 | 14.27 | 13.89 | 14.36 |
| - = No Data Reported; -- = Not Applicable; NA = Not Available; W = Withheld to avoid disclosure of individual company data. |
| Release Date: 6/30/2026 |
| Next Release Date: 7/31/2026 |