|
Download Data (XLS File) |
|
||||||||
|
||||||||
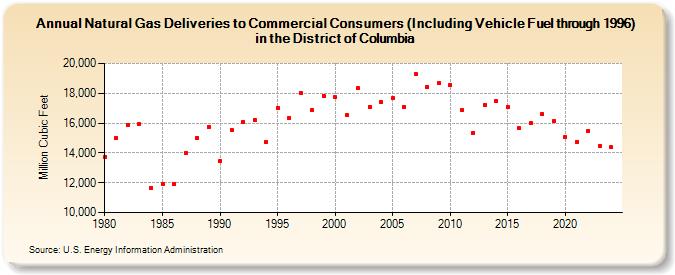
| Natural Gas Deliveries to Commercial Consumers (Including Vehicle Fuel through 1996) in the District of Columbia (Million Cubic Feet) | ||||||||
| Decade | Year-0 | Year-1 | Year-2 | Year-3 | Year-4 | Year-5 | Year-6 | Year-7 | Year-8 | Year-9 |
|---|---|---|---|---|---|---|---|---|---|---|
| 1980's | 13,752 | 14,993 | 15,881 | 15,945 | 11,680 | 11,921 | 11,934 | 13,999 | 15,012 | 15,741 |
| 1990's | 13,473 | 15,550 | 16,103 | 16,229 | 14,742 | 17,035 | 16,347 | 18,012 | 16,862 | 17,837 |
| 2000's | 17,728 | 16,546 | 18,332 | 17,098 | 17,384 | 17,683 | 17,107 | 19,297 | 18,411 | 18,705 |
| 2010's | 18,547 | 16,892 | 15,363 | 17,234 | 17,498 | 17,113 | 15,648 | 16,040 | 16,621 | 16,125 |
| 2020's | 15,072 | 14,760 | 15,489 | 14,483 | 14,266 | 15,415 |
| - = No Data Reported; -- = Not Applicable; NA = Not Available; W = Withheld to avoid disclosure of individual company data. |
| Release Date: 6/30/2026 |
| Next Release Date: 7/31/2026 |