|
Download Data (XLS File) |
|
||||||||
|
||||||||
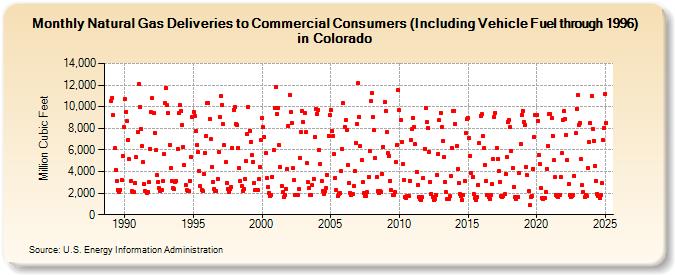
| Natural Gas Deliveries to Commercial Consumers (Including Vehicle Fuel through 1996) in Colorado (Million Cubic Feet) | ||||||||
| Year | Jan | Feb | Mar | Apr | May | Jun | Jul | Aug | Sep | Oct | Nov | Dec |
|---|---|---|---|---|---|---|---|---|---|---|---|---|
| 1989 | 10,522 | 10,845 | 9,208 | 6,135 | 4,160 | 3,082 | 2,328 | 2,119 | 2,303 | 3,232 | 5,441 | 8,102 |
| 1990 | 10,718 | 9,546 | 8,633 | 6,902 | 5,116 | 3,122 | 2,167 | 2,127 | 2,069 | 2,918 | 5,301 | 7,682 |
| 1991 | 12,120 | 9,991 | 7,910 | 6,328 | 4,849 | 2,826 | 2,180 | 2,040 | 2,087 | 3,017 | 6,096 | 9,494 |
| 1992 | 10,794 | 9,450 | 7,609 | 5,965 | 3,631 | 3,055 | 2,430 | 2,183 | 2,312 | 3,078 | 5,594 | 10,319 |
| 1993 | 11,775 | 10,132 | 9,435 | 6,499 | 4,292 | 3,119 | 2,445 | 2,357 | 3,012 | 3,108 | 6,080 | 9,396 |
| 1994 | 10,134 | 9,633 | 8,295 | 6,300 | 4,573 | 2,745 | 2,268 | 2,192 | 2,211 | 3,136 | 5,319 | 9,064 |
| 1995 | 9,552 | 9,146 | 7,763 | 6,413 | 5,776 | 4,061 | 2,634 | 2,314 | 2,210 | 3,787 | 5,703 | 7,282 |
| 1996 | 10,333 | 10,325 | 8,873 | 6,977 | 4,424 | 3,052 | 2,406 | 2,156 | 2,227 | 3,306 | 5,807 | 9,028 |
| 1997 | 10,983 | 10,199 | 8,353 | 6,433 | 4,846 | 2,954 | 2,354 | 2,117 | 2,371 | 2,558 | 6,176 | 9,729 |
| 1998 | 9,954 | 8,403 | 8,262 | 6,187 | 4,320 | 3,087 | 2,655 | 2,166 | 2,371 | 3,321 | 4,973 | 7,432 |
| 1999 | 10,001 | 7,795 | 6,730 | 5,513 | 4,910 | 2,962 | 2,278 | 2,304 | 2,274 | 3,303 | 4,375 | 6,903 |
| 2000 | 8,959 | 8,106 | 7,202 | 5,699 | 3,411 | 2,537 | 2,027 | 1,761 | 1,823 | 3,529 | 5,955 | 9,864 |
| 2001 | 11,844 | 9,309 | 9,923 | 6,436 | 4,428 | 2,659 | 2,071 | 1,633 | 1,854 | 2,408 | 4,204 | 8,243 |
| 2002 | 11,111 | 9,511 | 8,502 | 4,288 | 3,209 | 1,819 | 1,807 | 1,832 | 2,343 | 5,279 | 7,658 | 9,580 |
| 2003 | 8,572 | 9,425 | 7,632 | 4,780 | 2,992 | 2,458 | 1,847 | 1,789 | 2,746 | 3,332 | 7,212 | 9,831 |
| 2004 | 9,347 | 9,735 | 5,996 | 4,673 | 3,122 | 2,201 | 1,923 | 2,214 | 2,515 | 3,691 | 7,318 | 9,222 |
| 2005 | 9,665 | 7,725 | 7,272 | 5,618 | 3,399 | 2,265 | 1,742 | 1,955 | 1,990 | 4,057 | 6,099 | 10,312 |
| 2006 | 8,162 | 8,788 | 7,887 | 4,568 | 2,952 | 2,015 | 1,809 | 1,882 | 2,647 | 4,056 | 6,672 | 8,414 |
| 2007 | 12,160 | 9,051 | 6,344 | 5,079 | 3,012 | 2,051 | 1,754 | 1,759 | 2,062 | 3,518 | 5,940 | 10,501 |
| 2008 | 11,265 | 9,027 | 7,803 | 5,257 | 3,488 | 2,168 | 1,982 | 2,212 | 2,082 | 3,808 | 6,295 | 10,419 |
| 2009 | 9,609 | 7,623 | 5,708 | 5,479 | 3,162 | 2,248 | 1,831 | 1,849 | 2,098 | 4,834 | 6,479 | 11,519 |
| 2010 | 9,656 | 8,736 | 6,772 | 4,653 | 3,175 | 1,633 | 1,566 | 1,765 | 1,718 | 3,156 | 6,905 | 7,923 |
| 2011 | 8,983 | 8,105 | 6,519 | 3,997 | 2,756 | 1,644 | 1,445 | 1,396 | 1,611 | 3,407 | 6,111 | 9,869 |
| 2012 | 8,551 | 8,003 | 5,809 | 3,049 | 1,960 | 1,681 | 1,357 | 1,473 | 1,805 | 3,699 | 5,650 | 8,758 |
| 2013 | 9,461 | 8,081 | 6,850 | 5,297 | 3,070 | 2,057 | 1,455 | 1,429 | 1,727 | 3,603 | 6,191 | 9,566 |
| 2014 | 9,605 | 8,402 | 6,357 | 4,234 | 2,932 | 1,937 | 1,767 | 1,361 | 1,862 | 3,118 | 7,587 | 8,844 |
| 2015 | 8,934 | 7,064 | 5,455 | 3,869 | 3,507 | 1,953 | 1,521 | 1,408 | 1,646 | 2,794 | 6,634 | 9,183 |
| 2016 | 9,288 | 7,280 | 6,191 | 4,606 | 3,120 | 1,833 | 1,637 | 1,494 | 1,812 | 2,823 | 5,113 | 9,068 |
| 2017 | 9,448 | 6,211 | 5,202 | 4,042 | 3,069 | 1,741 | 1,640 | 1,715 | 1,872 | 3,781 | 5,386 | 8,628 |
| 2018 | 8,797 | 8,092 | 5,940 | 4,338 | 2,609 | 1,656 | 1,496 | 1,620 | 1,648 | 3,901 | 6,526 | 9,266 |
| 2019 | 9,638 | 8,613 | 8,339 | 4,440 | 3,632 | 2,190 | 864 | 1,654 | 1,703 | 4,258 | 7,215 | 9,209 |
| 2020 | 9,233 | 8,709 | 5,536 | 4,649 | 2,467 | 1,587 | 1,480 | 1,558 | 2,108 | 4,266 | 6,386 | 9,304 |
| 2021 | 9,303 | 8,920 | 7,333 | 5,038 | 3,466 | 1,850 | 1,767 | 1,646 | 1,859 | 3,523 | 5,686 | 8,790 |
| 2022 | 9,579 | 8,867 | 7,420 | 5,065 | 2,811 | 1,807 | 1,657 | 1,747 | 1,869 | 3,614 | 7,532 | 9,827 |
| 2023 | 11,073 | 8,353 | 8,517 | 5,113 | 2,746 | 2,114 | 1,596 | 1,857 | 1,717 | 4,329 | 6,690 | 8,522 |
| 2024 | 11,059 | 7,997 | 6,891 | 4,516 | 3,173 | 1,954 | 1,739 | 1,520 | 1,850 | 2,913 | 6,961 | 8,087 |
| 2025 | 11,145 | 8,508 | 6,160 | 4,437 | 3,253 | 1,893 | 1,770 | 1,936 | 1,999 | 3,747 | 6,350 | 7,123 |
| 2026 | 8,805 | 6,418 | 4,786 | 3,454 | ||||||||
| - = No Data Reported; -- = Not Applicable; NA = Not Available; W = Withheld to avoid disclosure of individual company data. |
| Release Date: 6/30/2026 |
| Next Release Date: 7/31/2026 |