|
Download Data (XLS File) |
|
||||||||
|
||||||||
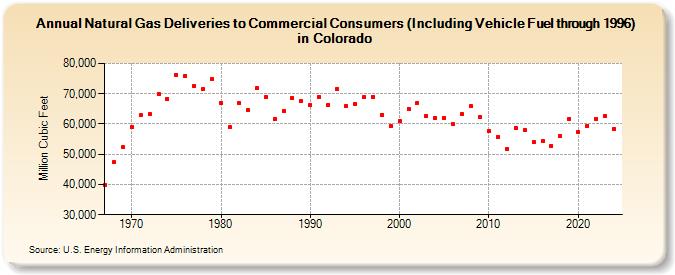
| Natural Gas Deliveries to Commercial Consumers (Including Vehicle Fuel through 1996) in Colorado (Million Cubic Feet) | ||||||||
| Decade | Year-0 | Year-1 | Year-2 | Year-3 | Year-4 | Year-5 | Year-6 | Year-7 | Year-8 | Year-9 |
|---|---|---|---|---|---|---|---|---|---|---|
| 1960's | 39,942 | 47,287 | 52,256 | |||||||
| 1970's | 59,081 | 62,805 | 63,154 | 69,844 | 68,322 | 76,288 | 75,959 | 72,597 | 71,422 | 74,831 |
| 1980's | 66,952 | 58,913 | 66,991 | 64,615 | 71,890 | 68,975 | 61,620 | 64,355 | 68,515 | 67,477 |
| 1990's | 66,290 | 68,938 | 66,420 | 71,647 | 65,870 | 66,639 | 68,914 | 69,074 | 63,132 | 59,346 |
| 2000's | 60,874 | 65,011 | 66,939 | 62,616 | 61,956 | 62,099 | 59,851 | 63,231 | 65,806 | 62,441 |
| 2010's | 57,658 | 55,843 | 51,795 | 58,787 | 58,008 | 53,968 | 54,265 | 52,735 | 55,887 | 61,755 |
| 2020's | 57,282 | 59,180 | 61,795 | 62,628 | 58,659 | 58,322 |
| - = No Data Reported; -- = Not Applicable; NA = Not Available; W = Withheld to avoid disclosure of individual company data. |
| Release Date: 6/30/2026 |
| Next Release Date: 7/31/2026 |