|
Download Data (XLS File) |
|
||||||||
|
||||||||
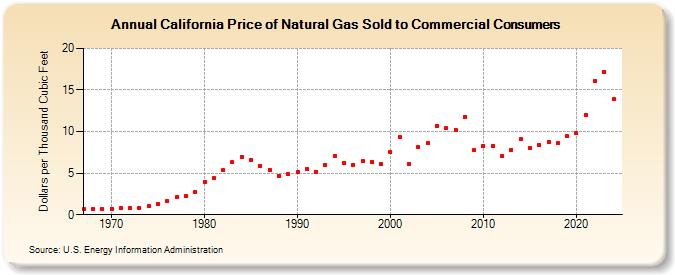
| California Price of Natural Gas Sold to Commercial Consumers (Dollars per Thousand Cubic Feet) | ||||||||
| Decade | Year-0 | Year-1 | Year-2 | Year-3 | Year-4 | Year-5 | Year-6 | Year-7 | Year-8 | Year-9 |
|---|---|---|---|---|---|---|---|---|---|---|
| 1960's | 0.68 | 0.69 | 0.69 | |||||||
| 1970's | 0.73 | 0.76 | 0.81 | 0.85 | 0.99 | 1.29 | 1.59 | 2.07 | 2.24 | 2.73 |
| 1980's | 3.98 | 4.38 | 5.32 | 6.33 | 6.95 | 6.63 | 5.86 | 5.42 | 4.68 | 4.88 |
| 1990's | 5.12 | 5.50 | 5.15 | 6.03 | 7.12 | 6.21 | 5.96 | 6.41 | 6.33 | 6.14 |
| 2000's | 7.54 | 9.33 | 6.07 | 8.15 | 8.63 | 10.69 | 10.43 | 10.20 | 11.75 | 7.75 |
| 2010's | 8.30 | 8.29 | 7.05 | 7.81 | 9.05 | 8.04 | 8.42 | 8.76 | 8.57 | 9.41 |
| 2020's | 9.78 | 12.04 | 16.13 | 17.20 | 14.01 | 16.56 |
| - = No Data Reported; -- = Not Applicable; NA = Not Available; W = Withheld to avoid disclosure of individual company data. |
| Release Date: 6/30/2026 |
| Next Release Date: 7/31/2026 |