|
Download Data (XLS File) |
|
||||||||
|
||||||||
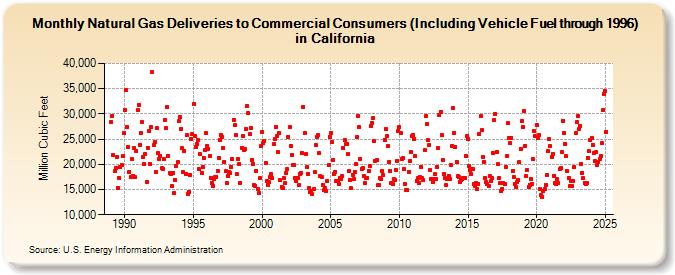
| Natural Gas Deliveries to Commercial Consumers (Including Vehicle Fuel through 1996) in California (Million Cubic Feet) | ||||||||
| Year | Jan | Feb | Mar | Apr | May | Jun | Jul | Aug | Sep | Oct | Nov | Dec |
|---|---|---|---|---|---|---|---|---|---|---|---|---|
| 1989 | 28,465 | 29,564 | 21,880 | 18,656 | 19,249 | 21,469 | 15,319 | 17,351 | 19,452 | 19,856 | 21,665 | 26,192 |
| 1990 | 30,798 | 34,767 | 27,425 | 23,423 | 18,540 | 17,392 | 21,030 | 17,705 | 23,233 | 17,384 | 22,637 | 30,759 |
| 1991 | 31,793 | 23,911 | 26,128 | 28,375 | 21,468 | 20,003 | 22,080 | 16,547 | 23,307 | 26,510 | 20,109 | 27,379 |
| 1992 | 38,234 | 23,834 | 24,413 | 18,379 | 27,118 | 22,150 | 21,150 | 21,633 | 19,247 | 19,112 | 20,999 | 28,738 |
| 1993 | 27,151 | 31,334 | 21,654 | 18,276 | 18,032 | 15,638 | 18,341 | 14,348 | 16,845 | 19,708 | 20,404 | 28,553 |
| 1994 | 29,342 | 27,032 | 23,156 | 18,463 | 22,621 | 18,091 | 25,752 | 14,123 | 14,604 | 17,844 | 25,032 | 25,929 |
| 1995 | 31,883 | 25,693 | 23,399 | 23,976 | 24,831 | 19,028 | 21,954 | 18,362 | 19,391 | 21,272 | 22,818 | 26,152 |
| 1996 | 23,655 | 23,098 | 21,723 | 17,358 | 16,348 | 15,772 | 17,155 | 17,540 | 17,544 | 18,727 | 21,313 | 24,836 |
| 1997 | 25,777 | 25,491 | 23,316 | 20,497 | 18,596 | 16,305 | 17,772 | 18,558 | 18,325 | 19,458 | 20,984 | 28,845 |
| 1998 | 27,792 | 25,831 | 17,981 | 20,978 | 20,004 | 16,352 | 23,301 | 25,640 | 22,759 | 23,016 | 26,959 | 31,538 |
| 1999 | 30,085 | 25,915 | 27,245 | 20,909 | 20,081 | 15,884 | 15,701 | 18,733 | 15,049 | 14,337 | 17,213 | 23,548 |
| 2000 | 26,495 | 24,242 | 24,531 | 20,237 | 16,684 | 15,966 | 16,392 | 17,572 | 17,990 | 17,276 | 24,057 | 24,997 |
| 2001 | 27,492 | 25,562 | 22,438 | 26,237 | 16,799 | 15,537 | 15,370 | 17,275 | 16,322 | 18,308 | 19,010 | 25,444 |
| 2002 | 27,340 | 23,711 | 21,883 | 19,797 | 19,836 | 17,245 | 16,694 | 17,287 | 15,819 | 18,131 | 18,290 | 22,275 |
| 2003 | 31,390 | 26,125 | 21,962 | 19,424 | 18,107 | 15,352 | 14,488 | 14,695 | 14,050 | 15,035 | 18,426 | 23,860 |
| 2004 | 25,447 | 25,795 | 22,236 | 17,684 | 17,561 | 15,914 | 14,895 | 15,212 | 14,792 | 16,771 | 19,780 | 25,510 |
| 2005 | 26,277 | 24,408 | 20,903 | 18,166 | 18,477 | 16,762 | 16,627 | 16,074 | 17,357 | 17,171 | 17,669 | 23,190 |
| 2006 | 24,730 | 23,938 | 24,062 | 21,985 | 18,659 | 16,958 | 15,204 | 17,944 | 16,993 | 18,536 | 20,041 | 25,383 |
| 2007 | 29,681 | 27,397 | 21,122 | 19,133 | 19,239 | 17,712 | 16,270 | 17,262 | 17,312 | 18,657 | 19,706 | 27,531 |
| 2008 | 28,250 | 29,244 | 24,547 | 20,707 | 20,871 | 15,833 | 15,841 | 17,203 | 17,084 | 18,682 | 17,894 | 24,889 |
| 2009 | 27,043 | 25,548 | 23,555 | 20,450 | 18,677 | 16,334 | 16,067 | 17,021 | 16,800 | 18,911 | 20,687 | 26,680 |
| 2010 | 27,422 | 26,257 | 21,064 | 21,182 | 19,105 | 16,061 | 14,990 | 14,858 | 18,544 | 20,568 | 22,395 | 25,550 |
| 2011 | 25,875 | 25,063 | 21,614 | 16,716 | 17,184 | 16,310 | 17,515 | 19,562 | 17,219 | 16,840 | 22,753 | 29,490 |
| 2012 | 27,921 | 24,761 | 23,782 | 18,780 | 17,026 | 16,507 | 17,022 | 17,991 | 17,027 | 19,476 | 23,169 | 29,686 |
| 2013 | 30,439 | 25,810 | 20,795 | 18,038 | 17,317 | 15,833 | 17,128 | 17,774 | 17,036 | 19,896 | 23,656 | 31,124 |
| 2014 | 26,168 | 23,504 | 20,512 | 17,614 | 17,418 | 16,551 | 16,799 | 17,141 | 17,313 | 17,355 | 21,710 | 25,591 |
| 2015 | 25,021 | 19,598 | 18,893 | 18,080 | 19,132 | 16,147 | 15,782 | 16,351 | 15,078 | 16,134 | 26,091 | 29,484 |
| 2016 | 26,743 | 21,460 | 20,549 | 17,218 | 16,478 | 16,005 | 15,669 | 17,665 | 16,696 | 17,303 | 22,313 | 28,868 |
| 2017 | 29,953 | 22,399 | 19,964 | 17,261 | 16,233 | 14,780 | 15,170 | 16,202 | 16,068 | 19,397 | 21,743 | 28,182 |
| 2018 | 25,305 | 24,163 | 25,288 | 18,730 | 17,524 | 16,142 | 15,507 | 16,398 | 16,863 | 20,372 | 23,093 | 28,627 |
| 2019 | 27,444 | 30,619 | 23,676 | 17,595 | 18,840 | 15,505 | 15,947 | 17,132 | 16,093 | 20,971 | 26,624 | 25,534 |
| 2020 | 27,770 | 25,218 | 25,755 | 15,085 | 13,972 | 13,572 | 14,698 | 15,037 | 15,965 | 17,954 | 22,621 | 24,994 |
| 2021 | 23,555 | 21,545 | 22,128 | 17,748 | 16,277 | 16,050 | 17,041 | 16,316 | 19,004 | 19,250 | 22,426 | 28,678 |
| 2022 | 26,278 | 24,045 | 21,572 | 18,577 | 17,374 | 15,611 | 16,739 | 15,681 | 16,777 | 19,462 | 26,188 | 28,318 |
| 2023 | 29,575 | 27,074 | 27,695 | 20,019 | 18,374 | 17,269 | 16,391 | 16,060 | 16,336 | 21,333 | 22,589 | 24,847 |
| 2024 | 25,183 | 23,882 | 22,276 | 20,655 | 22,340 | 19,792 | 20,502 | 21,000 | 21,643 | 24,147 | 30,658 | 33,982 |
| 2025 | 34,465 | 26,462 | 28,584 | 23,206 | 21,694 | 21,872 | 22,086 | 21,294 | 20,419 | 24,564 | 28,778 | 31,664 |
| 2026 | 30,347 | 24,841 | 20,175 | 22,436 | ||||||||
| - = No Data Reported; -- = Not Applicable; NA = Not Available; W = Withheld to avoid disclosure of individual company data. |
| Release Date: 6/30/2026 |
| Next Release Date: 7/31/2026 |