|
Download Data (XLS File) |
|
||||||||
|
||||||||
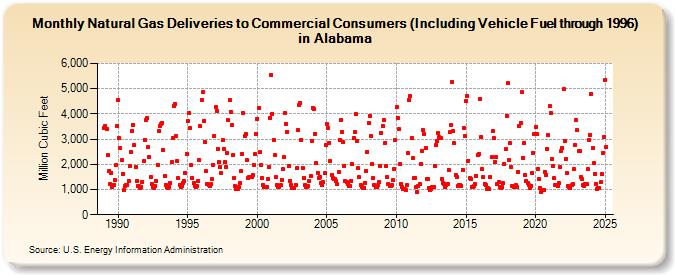
| Natural Gas Deliveries to Commercial Consumers (Including Vehicle Fuel through 1996) in Alabama (Million Cubic Feet) | ||||||||
| Year | Jan | Feb | Mar | Apr | May | Jun | Jul | Aug | Sep | Oct | Nov | Dec |
|---|---|---|---|---|---|---|---|---|---|---|---|---|
| 1989 | 3,434 | 3,514 | 3,395 | 2,369 | 1,720 | 1,215 | 1,673 | 1,117 | 1,189 | 1,382 | 1,955 | 3,507 |
| 1990 | 4,550 | 3,040 | 2,645 | 2,167 | 1,626 | 984 | 1,157 | 1,164 | 1,195 | 1,353 | 1,921 | 2,487 |
| 1991 | 3,334 | 3,576 | 2,761 | 1,886 | 1,332 | 1,149 | 1,128 | 1,052 | 1,093 | 1,311 | 2,120 | 2,968 |
| 1992 | 3,739 | 3,833 | 2,671 | 2,287 | 1,513 | 1,225 | 1,108 | 1,078 | 1,136 | 1,320 | 1,983 | 3,338 |
| 1993 | 3,532 | 3,599 | 3,655 | 2,569 | 1,551 | 1,179 | 1,084 | 1,070 | 1,111 | 1,259 | 2,073 | 3,041 |
| 1994 | 4,325 | 4,399 | 3,116 | 2,141 | 1,446 | 1,187 | 1,093 | 1,140 | 1,278 | 1,323 | 1,651 | 2,427 |
| 1995 | 3,708 | 4,029 | 3,432 | 1,963 | 1,454 | 1,242 | 1,149 | 1,110 | 1,139 | 1,323 | 2,177 | 3,502 |
| 1996 | 4,561 | 4,849 | 3,735 | 2,881 | 1,716 | 1,234 | 1,169 | 1,133 | 1,207 | 1,402 | 1,991 | 3,123 |
| 1997 | 4,257 | 4,120 | 2,622 | 2,089 | 1,901 | 1,642 | 2,947 | 2,622 | 2,075 | 1,903 | 2,437 | 3,745 |
| 1998 | 4,569 | 4,082 | 3,566 | 2,386 | 1,457 | 1,122 | 1,027 | 1,026 | 1,091 | 1,248 | 1,716 | 2,414 |
| 1999 | 4,044 | 3,104 | 3,187 | 2,154 | 1,447 | 1,511 | 1,499 | 1,493 | 1,568 | 1,972 | 2,395 | 3,208 |
| 2000 | 3,812 | 4,236 | 2,481 | 1,972 | 1,466 | 1,184 | 1,087 | 1,080 | 1,119 | 1,410 | 1,883 | 3,851 |
| 2001 | 5,552 | 4,007 | 2,969 | 2,357 | 1,497 | 1,180 | 1,104 | 1,092 | 1,164 | 1,394 | 1,798 | 2,275 |
| 2002 | 4,036 | 3,605 | 3,301 | 1,928 | 1,352 | 1,184 | 1,068 | 1,062 | 1,075 | 1,188 | 1,842 | 3,370 |
| 2003 | 4,358 | 4,429 | 2,958 | 1,858 | 1,476 | 1,161 | 1,084 | 1,113 | 1,121 | 1,333 | 1,535 | 2,929 |
| 2004 | 4,246 | 4,184 | 3,218 | 2,045 | 1,670 | 1,441 | 1,515 | 1,255 | 1,174 | 1,286 | 1,639 | 2,783 |
| 2005 | 3,595 | 3,442 | 2,844 | 2,130 | 1,590 | 1,437 | 1,405 | 1,404 | 1,328 | 1,200 | 1,705 | 2,965 |
| 2006 | 3,762 | 3,283 | 2,880 | 1,949 | 1,328 | 1,296 | 1,234 | 1,133 | 1,133 | 1,351 | 2,009 | 3,039 |
| 2007 | 3,262 | 3,982 | 2,932 | 1,834 | 1,479 | 1,182 | 1,116 | 1,054 | 1,070 | 1,274 | 1,737 | 2,498 |
| 2008 | 3,641 | 3,923 | 3,105 | 2,020 | 1,452 | 1,180 | 1,114 | 1,109 | 1,166 | 1,304 | 1,951 | 3,253 |
| 2009 | 3,515 | 3,738 | 2,834 | 1,927 | 1,489 | 1,213 | 1,122 | 1,122 | 1,190 | 1,359 | 1,828 | 2,955 |
| 2010 | 4,277 | 3,856 | 3,386 | 2,027 | 1,237 | 1,104 | 1,006 | 1,038 | 983 | 1,179 | 2,444 | 4,535 |
| 2011 | 4,708 | 3,036 | 2,244 | 1,448 | 1,460 | 1,097 | 897 | 1,125 | 1,221 | 2,025 | 2,540 | 3,342 |
| 2012 | 3,184 | 2,637 | 1,414 | 1,435 | 1,065 | 998 | 1,007 | 1,082 | 1,094 | 1,933 | 2,760 | 2,941 |
| 2013 | 3,238 | 3,092 | 3,026 | 1,425 | 1,273 | 1,220 | 1,081 | 1,170 | 1,203 | 1,788 | 3,263 | 3,545 |
| 2014 | 5,283 | 3,316 | 2,834 | 1,592 | 1,496 | 1,132 | 1,189 | 1,186 | 1,146 | 1,789 | 3,445 | 3,125 |
| 2015 | 4,516 | 4,712 | 2,148 | 1,446 | 1,418 | 1,114 | 1,117 | 1,147 | 1,201 | 1,549 | 2,372 | 2,421 |
| 2016 | 4,582 | 3,092 | 1,816 | 1,488 | 1,235 | 1,171 | 1,007 | 1,045 | 1,029 | 1,502 | 2,270 | 3,314 |
| 2017 | 3,026 | 2,092 | 2,302 | 1,212 | 1,280 | 1,080 | 1,046 | 1,108 | 1,239 | 1,996 | 2,604 | 3,930 |
| 2018 | 5,216 | 2,187 | 2,832 | 1,902 | 1,142 | 1,101 | 1,108 | 1,162 | 1,091 | 1,709 | 3,528 | 3,658 |
| 2019 | 4,868 | 2,268 | 2,841 | 1,573 | 1,356 | 1,270 | 1,169 | 1,067 | 1,152 | 1,672 | 2,442 | 3,198 |
| 2020 | 3,496 | 3,201 | 1,821 | 1,425 | 1,065 | 909 | 961 | 989 | 1,695 | 1,591 | 2,609 | 3,144 |
| 2021 | 4,318 | 4,050 | 2,206 | 1,914 | 1,439 | 1,181 | 1,175 | 1,142 | 1,245 | 1,876 | 2,521 | 2,644 |
| 2022 | 4,975 | 2,931 | 2,216 | 1,656 | 1,151 | 1,086 | 1,063 | 1,160 | 1,204 | 1,819 | 2,769 | 3,745 |
| 2023 | 3,347 | 2,535 | 2,531 | 1,496 | 1,412 | 1,184 | 1,152 | 1,208 | 1,223 | 1,808 | 2,972 | 3,175 |
| 2024 | 5,086 | 2,804 | 2,157 | 1,719 | 1,306 | 1,093 | 1,138 | 1,101 | 1,356 | 1,710 | 2,616 | 3,287 |
| 2025 | 5,514 | 2,712 | 2,242 | 1,461 | 1,349 | 1,083 | 1,233 | 1,157 | 1,289 | 1,779 | 2,633 | 3,903 |
| 2026 | 4,851 | 2,931 | 1,902 | 1,471 | ||||||||
| - = No Data Reported; -- = Not Applicable; NA = Not Available; W = Withheld to avoid disclosure of individual company data. |
| Release Date: 6/30/2026 |
| Next Release Date: 7/31/2026 |