|
Download Data (XLS File) |
|
||||||||
|
||||||||
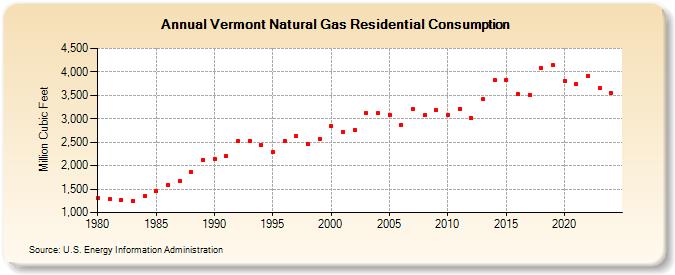
| Vermont Natural Gas Residential Consumption (Million Cubic Feet) | ||||||||
| Decade | Year-0 | Year-1 | Year-2 | Year-3 | Year-4 | Year-5 | Year-6 | Year-7 | Year-8 | Year-9 |
|---|---|---|---|---|---|---|---|---|---|---|
| 1980's | 1,301 | 1,290 | 1,278 | 1,252 | 1,352 | 1,456 | 1,595 | 1,663 | 1,868 | 2,126 |
| 1990's | 2,150 | 2,203 | 2,520 | 2,530 | 2,438 | 2,299 | 2,523 | 2,631 | 2,454 | 2,565 |
| 2000's | 2,843 | 2,719 | 2,761 | 3,118 | 3,112 | 3,088 | 2,874 | 3,207 | 3,075 | 3,183 |
| 2010's | 3,078 | 3,214 | 3,012 | 3,415 | 3,826 | 3,833 | 3,518 | 3,509 | 4,081 | 4,139 |
| 2020's | 3,808 | 3,732 | 3,915 | 3,649 | 3,539 | 3,940 |
| - = No Data Reported; -- = Not Applicable; NA = Not Available; W = Withheld to avoid disclosure of individual company data. |
| Release Date: 6/30/2026 |
| Next Release Date: 7/31/2026 |