|
Download Data (XLS File) |
|
||||||||
|
||||||||
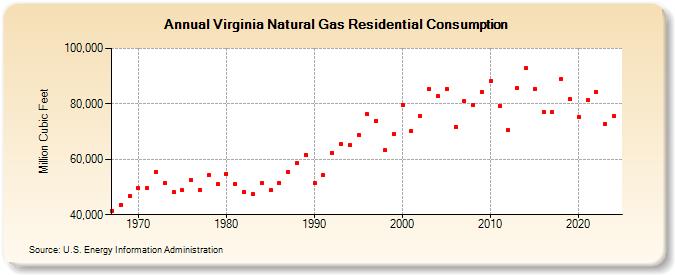
| Virginia Natural Gas Residential Consumption (Million Cubic Feet) | ||||||||
| Decade | Year-0 | Year-1 | Year-2 | Year-3 | Year-4 | Year-5 | Year-6 | Year-7 | Year-8 | Year-9 |
|---|---|---|---|---|---|---|---|---|---|---|
| 1960's | 41,495 | 43,582 | 46,663 | |||||||
| 1970's | 49,554 | 49,488 | 55,427 | 51,618 | 48,160 | 48,802 | 52,491 | 48,953 | 54,250 | 50,999 |
| 1980's | 54,825 | 50,997 | 48,253 | 47,318 | 51,439 | 48,752 | 51,517 | 55,421 | 58,539 | 61,712 |
| 1990's | 51,438 | 54,199 | 62,431 | 65,472 | 65,176 | 68,712 | 76,214 | 73,905 | 63,186 | 69,189 |
| 2000's | 79,701 | 70,249 | 75,476 | 85,330 | 82,755 | 85,355 | 71,693 | 80,957 | 79,725 | 84,445 |
| 2010's | 88,157 | 79,301 | 70,438 | 85,702 | 92,817 | 85,464 | 77,170 | 76,904 | 89,036 | 81,831 |
| 2020's | 75,264 | 81,261 | 84,255 | 72,802 | 75,246 | 87,301 |
| - = No Data Reported; -- = Not Applicable; NA = Not Available; W = Withheld to avoid disclosure of individual company data. |
| Release Date: 6/30/2026 |
| Next Release Date: 7/31/2026 |