|
Download Data (XLS File) |
|
||||||||
|
||||||||
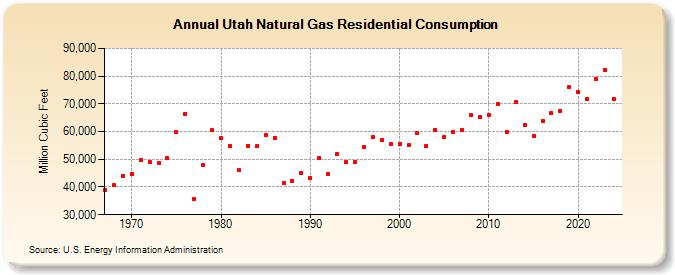
| Utah Natural Gas Residential Consumption (Million Cubic Feet) | ||||||||
| Decade | Year-0 | Year-1 | Year-2 | Year-3 | Year-4 | Year-5 | Year-6 | Year-7 | Year-8 | Year-9 |
|---|---|---|---|---|---|---|---|---|---|---|
| 1960's | 38,935 | 40,779 | 43,948 | |||||||
| 1970's | 44,637 | 49,849 | 48,855 | 48,647 | 50,347 | 59,736 | 66,417 | 35,558 | 47,783 | 60,462 |
| 1980's | 57,639 | 54,789 | 45,957 | 54,938 | 54,639 | 58,727 | 57,654 | 41,536 | 42,241 | 45,168 |
| 1990's | 43,424 | 50,572 | 44,701 | 51,779 | 48,922 | 48,975 | 54,344 | 58,108 | 56,843 | 55,474 |
| 2000's | 55,626 | 55,008 | 59,398 | 54,632 | 60,527 | 58,044 | 60,017 | 60,563 | 65,974 | 65,184 |
| 2010's | 66,087 | 70,076 | 59,801 | 70,491 | 62,458 | 58,562 | 63,929 | 66,700 | 67,415 | 75,938 |
| 2020's | 74,191 | 71,628 | 78,791 | 82,284 | 74,108 | 67,586 |
| - = No Data Reported; -- = Not Applicable; NA = Not Available; W = Withheld to avoid disclosure of individual company data. |
| Release Date: 6/30/2026 |
| Next Release Date: 7/31/2026 |