|
Download Data (XLS File) |
|
||||||||
|
||||||||
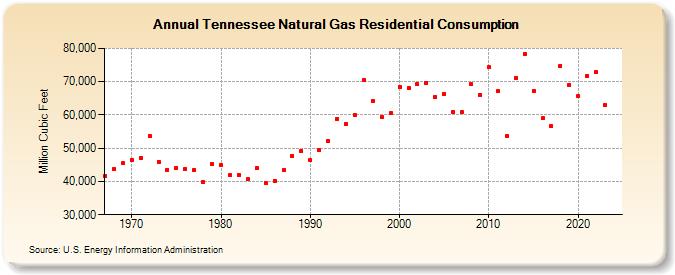
| Tennessee Natural Gas Residential Consumption (Million Cubic Feet) | ||||||||
| Decade | Year-0 | Year-1 | Year-2 | Year-3 | Year-4 | Year-5 | Year-6 | Year-7 | Year-8 | Year-9 |
|---|---|---|---|---|---|---|---|---|---|---|
| 1960's | 41,659 | 43,784 | 45,396 | |||||||
| 1970's | 46,571 | 46,992 | 53,763 | 45,993 | 43,586 | 44,020 | 43,749 | 43,530 | 39,807 | 45,136 |
| 1980's | 44,894 | 41,857 | 42,023 | 40,596 | 44,045 | 39,434 | 40,240 | 43,483 | 47,668 | 49,196 |
| 1990's | 46,340 | 49,357 | 52,220 | 58,919 | 57,334 | 59,994 | 70,423 | 64,130 | 59,386 | 60,561 |
| 2000's | 68,428 | 68,053 | 69,330 | 69,746 | 65,331 | 66,277 | 61,018 | 60,736 | 69,181 | 66,111 |
| 2010's | 74,316 | 67,190 | 53,810 | 71,241 | 78,395 | 67,312 | 58,924 | 56,661 | 74,802 | 69,088 |
| 2020's | 65,607 | 71,714 | 72,878 | 63,039 | 66,371 | 73,760 |
| - = No Data Reported; -- = Not Applicable; NA = Not Available; W = Withheld to avoid disclosure of individual company data. |
| Release Date: 6/30/2026 |
| Next Release Date: 7/31/2026 |