|
Download Data (XLS File) |
|
||||||||
|
||||||||
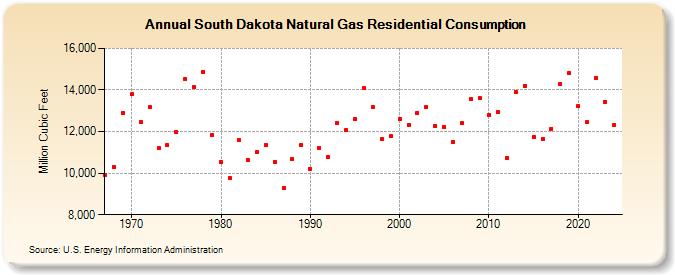
| South Dakota Natural Gas Residential Consumption (Million Cubic Feet) | ||||||||
| Decade | Year-0 | Year-1 | Year-2 | Year-3 | Year-4 | Year-5 | Year-6 | Year-7 | Year-8 | Year-9 |
|---|---|---|---|---|---|---|---|---|---|---|
| 1960's | 9,910 | 10,302 | 12,906 | |||||||
| 1970's | 13,784 | 12,436 | 13,182 | 11,190 | 11,338 | 11,969 | 14,510 | 14,141 | 14,874 | 11,830 |
| 1980's | 10,558 | 9,758 | 11,584 | 10,648 | 10,994 | 11,357 | 10,557 | 9,288 | 10,687 | 11,342 |
| 1990's | 10,204 | 11,218 | 10,791 | 12,431 | 12,056 | 12,610 | 14,085 | 13,203 | 11,646 | 11,766 |
| 2000's | 12,608 | 12,335 | 12,897 | 13,175 | 12,281 | 12,212 | 11,514 | 12,402 | 13,566 | 13,595 |
| 2010's | 12,815 | 12,961 | 10,742 | 13,920 | 14,213 | 11,751 | 11,663 | 12,146 | 14,280 | 14,809 |
| 2020's | 13,208 | 12,447 | 14,579 | 13,435 | 12,272 | 13,251 |
| - = No Data Reported; -- = Not Applicable; NA = Not Available; W = Withheld to avoid disclosure of individual company data. |
| Release Date: 6/30/2026 |
| Next Release Date: 7/31/2026 |