|
Download Data (XLS File) |
|
||||||||
|
||||||||
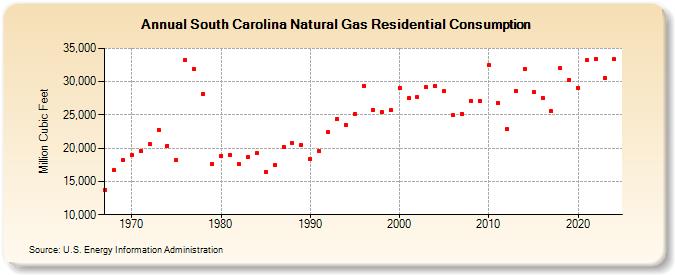
| South Carolina Natural Gas Residential Consumption (Million Cubic Feet) | ||||||||
| Decade | Year-0 | Year-1 | Year-2 | Year-3 | Year-4 | Year-5 | Year-6 | Year-7 | Year-8 | Year-9 |
|---|---|---|---|---|---|---|---|---|---|---|
| 1960's | 13,774 | 16,756 | 18,162 | |||||||
| 1970's | 18,930 | 19,607 | 20,627 | 22,758 | 20,383 | 18,211 | 33,231 | 31,875 | 28,214 | 17,675 |
| 1980's | 18,866 | 18,980 | 17,548 | 18,741 | 19,246 | 16,434 | 17,440 | 20,200 | 20,790 | 20,472 |
| 1990's | 18,396 | 19,612 | 22,392 | 24,345 | 23,486 | 25,164 | 29,406 | 25,741 | 25,430 | 25,669 |
| 2000's | 29,057 | 27,485 | 27,621 | 29,154 | 29,314 | 28,537 | 24,928 | 25,158 | 27,100 | 27,160 |
| 2010's | 32,430 | 26,851 | 22,834 | 28,642 | 31,904 | 28,414 | 27,562 | 25,538 | 31,994 | 30,316 |
| 2020's | 29,111 | 33,205 | 33,460 | 30,561 | 33,367 | 37,076 |
| - = No Data Reported; -- = Not Applicable; NA = Not Available; W = Withheld to avoid disclosure of individual company data. |
| Release Date: 6/30/2026 |
| Next Release Date: 7/31/2026 |