|
Download Data (XLS File) |
|
||||||||
|
||||||||
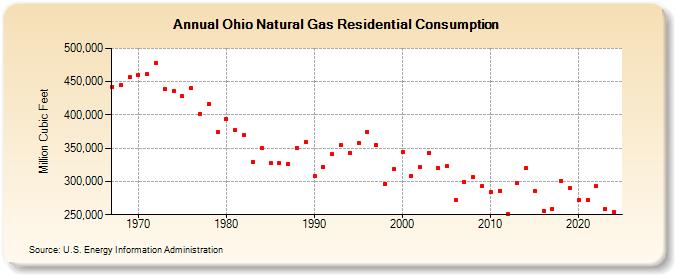
| Ohio Natural Gas Residential Consumption (Million Cubic Feet) | ||||||||
| Decade | Year-0 | Year-1 | Year-2 | Year-3 | Year-4 | Year-5 | Year-6 | Year-7 | Year-8 | Year-9 |
|---|---|---|---|---|---|---|---|---|---|---|
| 1960's | 442,360 | 444,964 | 456,414 | |||||||
| 1970's | 459,972 | 460,820 | 478,331 | 439,212 | 435,800 | 427,817 | 440,190 | 401,928 | 416,721 | 373,631 |
| 1980's | 393,759 | 377,134 | 369,437 | 329,647 | 350,296 | 327,591 | 327,300 | 326,480 | 350,612 | 359,148 |
| 1990's | 308,321 | 321,724 | 340,628 | 354,110 | 343,331 | 357,754 | 374,824 | 354,543 | 296,576 | 318,214 |
| 2000's | 343,920 | 308,534 | 321,317 | 343,037 | 320,823 | 322,697 | 272,261 | 299,577 | 306,529 | 292,429 |
| 2010's | 283,703 | 286,132 | 250,871 | 297,361 | 320,568 | 285,306 | 255,826 | 258,699 | 301,232 | 290,080 |
| 2020's | 271,863 | 272,676 | 292,734 | 258,335 | 247,246 | 298,791 |
| - = No Data Reported; -- = Not Applicable; NA = Not Available; W = Withheld to avoid disclosure of individual company data. |
| Release Date: 5/29/2026 |
| Next Release Date: 6/30/2026 |