|
Download Data (XLS File) |
|
||||||||
|
||||||||
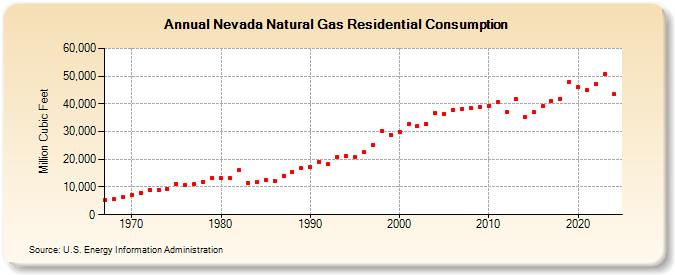
| Nevada Natural Gas Residential Consumption (Million Cubic Feet) | ||||||||
| Decade | Year-0 | Year-1 | Year-2 | Year-3 | Year-4 | Year-5 | Year-6 | Year-7 | Year-8 | Year-9 |
|---|---|---|---|---|---|---|---|---|---|---|
| 1960's | 5,230 | 5,493 | 6,297 | |||||||
| 1970's | 7,262 | 7,994 | 9,052 | 9,048 | 9,388 | 11,091 | 10,670 | 11,165 | 11,778 | 13,211 |
| 1980's | 13,182 | 13,112 | 15,983 | 11,427 | 11,891 | 12,602 | 12,226 | 14,141 | 15,275 | 16,765 |
| 1990's | 17,153 | 19,135 | 18,184 | 20,683 | 21,263 | 20,686 | 22,607 | 25,243 | 30,023 | 28,772 |
| 2000's | 29,942 | 32,609 | 31,958 | 32,848 | 36,534 | 36,397 | 37,937 | 38,088 | 38,665 | 38,742 |
| 2010's | 39,379 | 40,595 | 37,071 | 41,664 | 35,135 | 37,029 | 39,075 | 40,911 | 41,837 | 47,931 |
| 2020's | 46,009 | 44,848 | 47,112 | 50,610 | 44,066 | 39,901 |
| - = No Data Reported; -- = Not Applicable; NA = Not Available; W = Withheld to avoid disclosure of individual company data. |
| Release Date: 6/30/2026 |
| Next Release Date: 7/31/2026 |